Question
Find current ratio, quick ratio, inventory turnover, average collection period, average Payment period, total asset turnover, debt ratio, debt to equity ratio, times interest earned
Find current ratio, quick ratio, inventory turnover, average collection period, average Payment period, total asset turnover, debt ratio, debt to equity ratio, times interest earned ratio, gross profit margin, net profit margin, operating profit margin, earnings per share, return in assets, return on equity, P/E ratio, market/book ratio. For the three years.
| Industry Key Financial Ratios | |
| Current Ratio | 1.8 |
| Quick Ratio | .9 |
| Inventory Turnover | 6.25 |
| Average collection period | 8.55 |
| Average payment period | 8.55 |
| Average payment period | 89.6 |
| Total asset turnover | 5.45 |
| Debt ratio | 1.5 |
| Debt to equity ratio | 2.1 |
| Times interest earned ratio | 15.5 |
| Gross profit margin | 4.2 |
| Operating profit margin | 10.5 |
| Net profit margin | 4.5 |
| Earnings per share | 2.75 |
| Return in assets | 10.2 |
| Return on equity | 15.5 |
| P/E ratio | 8.9 |
| Market/Book ratio | 7.75 |
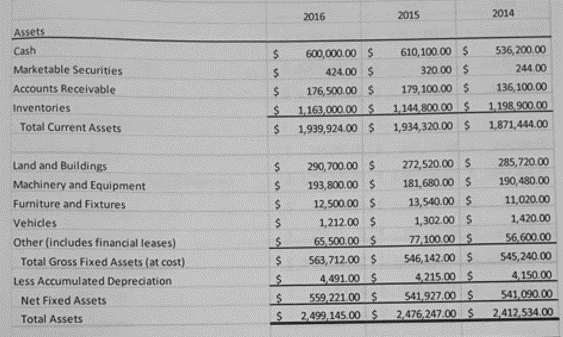
Balance sheet

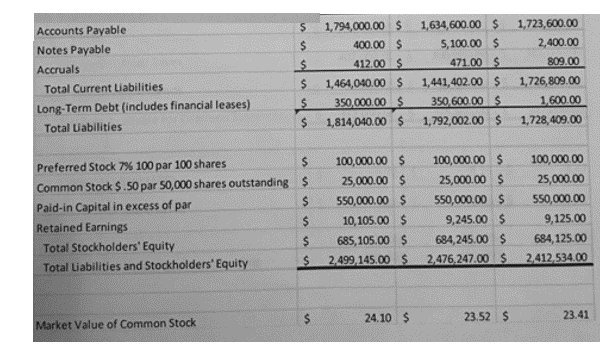
Liabilities and stockholders? Equity

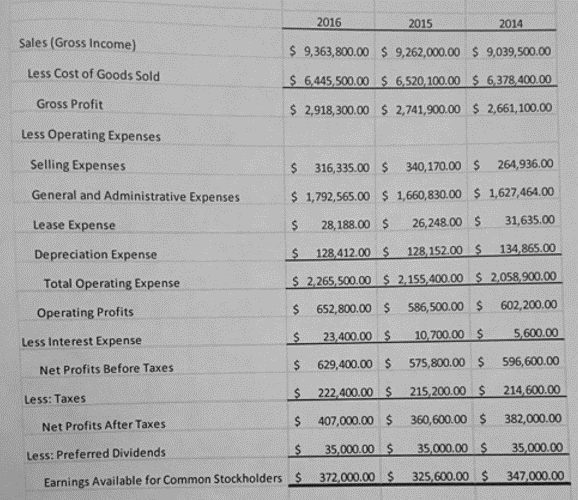
Income statement


Assets Cash Marketable Securities Accounts Receivable Inventories Total Current Assets Land and Buildings Machinery and Equipment Furniture and Fixtures Vehicles Other (includes financial leases) Total Gross Fixed Assets (at cost) Less Accumulated Depreciation Net Fixed Assets Total Assets $ $ $ $ $ $ $ $ $ $ $ $ $ 2016 600,000.00 $ 424.00 $ 176,500.00 $ 1,163,000.00 $ 1,939,924.00 $ 290,700.00 $ 193,800.00 $ 12,500.00 $ 1,212.00 $ 65,500.00 $ 563,712.00 $ 4,491.00 $ 559,221.00 $ 2,499,145.00 $ 2015 610,100.00 $ 320.00 $ 179,100.00 $ 1,144,800.00 $ 1,934,320.00 $ 272,520.00 $ 181,680.00 $ 13,540.00 $ 1,302.00 $ 77,100.00 $ 546,142.00 $ 4.215.00 $ 541,927.00 $ 2,476,247.00 $ 2014 536,200.00 244.00 136,100.00 1,198,900.00 1,871,444.00 285,720.00 190,480.00 11,020.00 1,420.00 56,600.00 545,240.00 4,150.00 541,090.00 2,412,534.00 Accounts Payable Notes Payable Accruals Total Current Liabilities Long-Term Debt (includes financial leases) Total Liabilities S $ $ $ Market Value of Common Stock $ $ Preferred Stock 7% 100 par 100 shares $ Common Stock $.50 par 50,000 shares outstanding $ Paid-in Capital in excess of par $ Retained Earnings $ Total Stockholders' Equity $ Total Liabilities and Stockholders' Equity $ 1,794,000.00 $ 400.00 $ 412.00 $ 1,464,040.00 $ 350,000.00 $ 1,814,040.00 $ 100,000.00 $ 25,000.00 $ 550,000.00 $ 10,105.00 $ 685,105.00 $ 2,499,145.00 $ 24.10 $ 1,634,600.00 $ 5,100.00 $ 471.00 $ 1,441,402.00 $ 350,600.00 $ 1,792,002.00 $ 100,000.00 $ 25,000.00 $ 550,000.00 $ 9,245.00 $ 684,245.00 $ 2,476,247.00 $ 23.52 $ 1,723,600.00 2,400.00 809.00 1,726,809.00 1,600.00 1,728,409.00 100,000.00 25,000.00 550,000.00 9,125.00 684,125.00 2,412,534.00 23.41 Sales (Gross Income) Less Cost of Goods Sold Gross Profit Less Operating Expenses Selling Expenses General and Administrative Expenses Lease Expense Depreciation Expense Total Operating Expense Operating Profits Less Interest Expense Net Profits Before Taxes Less: Taxes 2016 $9,363,800.00 $6,445,500.00 $ 2,918,300.00 $ 2,741,900.00 $ $ $ Earnings Available for Common Stockholders $ Net Profits After Taxes Less: Preferred Dividends 2015 2014 $ 9,262,000.00 $ 9,039,500.00 $ 6,520,100.00 $ 6,378,400.00 $ 2,661,100.00 $ 316,335.00 $ 340,170.00 $ 264,936.00 $ 1,792,565.00 $1,660,830.00 $ 1,627,464.00 28,188.00 $ 26,248.00 $ 31,635.00 134,865.00 128,152.00 $ $ $ 128,412.00 $ $ 2,265,500.00 $ 2,155,400.00 $ 2,058,900.00 $ 652,800.00 $ 586,500.00 $ 602,200.00 $ 23,400.00 $ 10,700.00 5,600.00 $ 629,400.00 $ 575,800.00 $ 596,600.00 222,400.00 $ 215,200.00 $ 214,600.00 407,000.00 $ 360,600.00 $ 382,000.00 35,000.00 $ 35,000.00 $ 35,000.00 372,000.00 $ 325,600.00 $ 347,000.00 Earnings per Share (EPS) Dividends per Share (DPS) Tax Rate Number of common shares outstanding $ $ 3.72 $ 1.86 $ 40.00% 100,000 3.26 $ 1.63 $ 40.00% 100,000 3.47 1.74 40.00% 100,000
Step by Step Solution
3.38 Rating (160 Votes )
There are 3 Steps involved in it
Step: 1
Calculation of Current ratio Current ratio is given by following formula Current ratio Current Asset...
Get Instant Access to Expert-Tailored Solutions
See step-by-step solutions with expert insights and AI powered tools for academic success
Step: 2

Step: 3

Document Format ( 2 attachments)
609723b0f23ca_27538.pdf
180 KBs PDF File
609723b0f23ca_27538.docx
120 KBs Word File
Ace Your Homework with AI
Get the answers you need in no time with our AI-driven, step-by-step assistance
Get Started


