Answered step by step
Verified Expert Solution
Question
1 Approved Answer
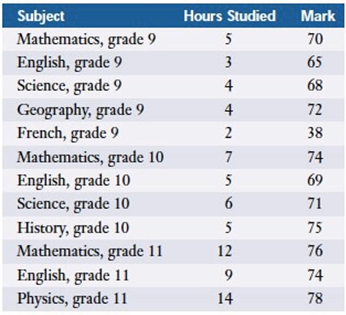
Jerome has kept track of the hours he spent studying and his marks on examinations. a) Create a scatter plot for Jerome?s data and classify
Jerome has kept track of the hours he spent studying and his marks on examinations.

a) Create a scatter plot for Jerome?s data and classify the linear correlation.
b) Perform a regression analysis. Identify the equation of the line of best fit as y1, and record the correlation coefficient.
c) Identify and outliers.
d) Repeat part b) with the outlier removed. Identify this line as y2.
Subject Mathematics, grade 9 English, grade 9 Science, grade 9 Geography, grade 9 French, grade 9 Mathematics, grade 10 English, grade 10 Science, grade 10 History, grade 10 Mathematics, grade 11 English, grade 11 Physics, grade 11 Hours Studied 5 3 4 4 2 7 5 6 5 12 9 14 Mark 70 65 68 72 38 74 69 71 75 76 74 78
Step by Step Solution
★★★★★
3.46 Rating (159 Votes )
There are 3 Steps involved in it
Step: 1
A Scatter plot of the data is B After running the regression anal...
Get Instant Access to Expert-Tailored Solutions
See step-by-step solutions with expert insights and AI powered tools for academic success
Step: 2

Step: 3

Ace Your Homework with AI
Get the answers you need in no time with our AI-driven, step-by-step assistance
Get Started


