Question
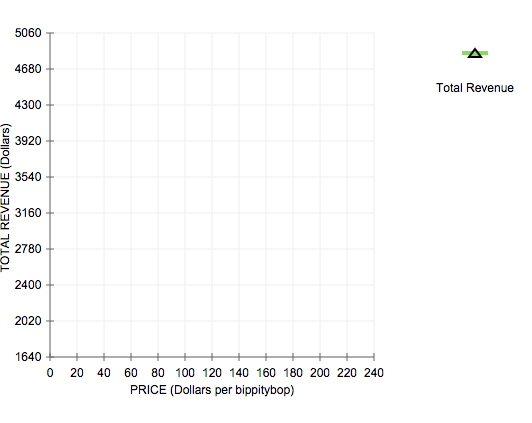
On the following graph, use the green point (triangle symbol) to plot the annual total revenue when the market price is $40, $60, $80, $100,
On the following graph, use the green point (triangle symbol) to plot the annual total revenue when the market price is $40, $60, $80, $100, $120, $140, and $160 per bippitybop.
Given graph:


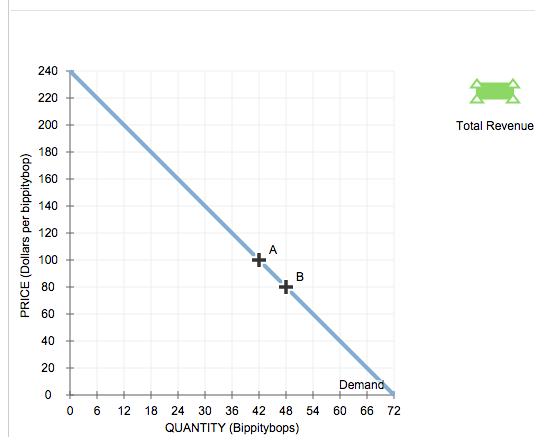
According to the midpoint method, the price elasticity of demand between points A and B is approximately (0,0.6,1.67,27).
Suppose the price of bippitybops is currently $100 per bippitybop, shown as point A on the initial graph. Because the price elasticity of demand between points A and B is (elastic, inelastic, unit elastic) , a $20-per-bippitybop decrease in price will lead to (increase, decrease, no change)in total revenue per day.
In general, in order for a price increase to cause an increase in total revenue, demand must be (elastic, inelastic, unit elastic).
PRICE (Dollars per bippitybop) 240 220 200 180 160 140 120 100 80 60 40 20 0 H 0 + 6 *1 00 B + 12 18 24 30 36 42 48 54 QUANTITY (Bippitybops) Demand 60 66 72 Total Revenue REVENUE (Dollars) 5060 4680 4300 3920 3540 3160 2780 2400 2020 1640+ 0 + + 20 40 60 80 100 120 140 160 180 200 220 240 PRICE (Dollars per bippitybop) Total Revenue
Step by Step Solution
3.29 Rating (152 Votes )
There are 3 Steps involved in it
Step: 1
Total revenue is found by multiplying price with the quantity The points ar...
Get Instant Access to Expert-Tailored Solutions
See step-by-step solutions with expert insights and AI powered tools for academic success
Step: 2

Step: 3

Ace Your Homework with AI
Get the answers you need in no time with our AI-driven, step-by-step assistance
Get Started


