Question
The accompanying Minitab regression output is based on data that appeared in the article Application of Design of Experiments for Modeling Surface Roughness in Ultrasonic
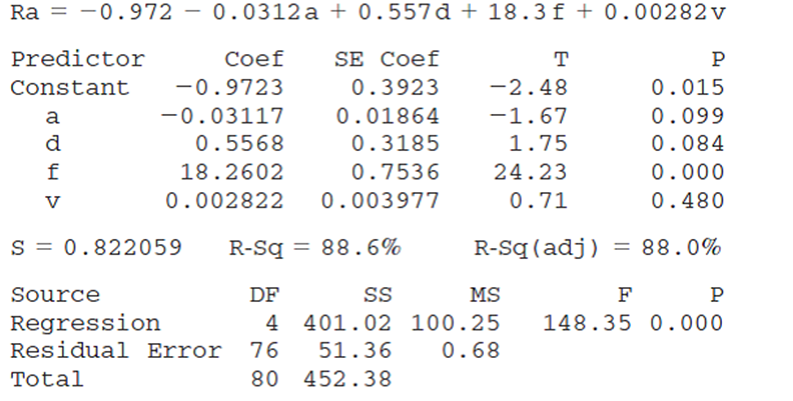
The accompanying Minitab regression output is based on data that appeared in the article "Application of Design of Experiments for Modeling Surface Roughness in Ultrasonic Vibration Turning" (J. of Engr. Manuf., 2009: 641-652). The response variable is surface roughness (mm), and the independent variables are vibration amplitude (mm), depth of cut (mm), feed rate (mm/rev), and cutting speed (m/min), respectively.
a. How many observations were there in the data set?
b. Interpret the coefficient of multiple determination.
c. Carry out a test of hypotheses to decide if the model specifies a useful relationship between the response variable and at least one of the predictors.
d. Interpret the number 18.2602 that appears in the Coef column.
e. At significance level .10, can any single one of the predictors be eliminated from the model provided that all of the other predictors are retained?
f. The estimated SD of Y? when the values of the four predictors are 10, .5, .25, and 50, respectively, is .1178. Calculate both a Cl for true average roughness and a PI for the roughness of a single specimen, and compare these two intervals.The regression equation is

Ra=0.972 0.0312a Predictor Coef Constant -0.9723 -0.03117 + 0.557d+18.3f+0.00282 v SE Coef 0.3923 0.01864 0.3185 0.7536 a d f V P 0.015 0.099 0.084 0.000 0.480 S = 0.822059 R-Sq = 88.6% R-Sq (adj) = 88.0% Source DF SS MS F P Regression 0.000 4 401.02 100.25 Residual Error 76 51.36 Total 452.38 0.68 80 T -2.48 -1.67 1.75 24.23 0.71 0.5568 18.2602 0.002822 0.003977 148.35
Step by Step Solution
3.35 Rating (161 Votes )
There are 3 Steps involved in it
Step: 1
a The total number of degrees of freedom is n 1 80 Therefore the number of observations in the data ...
Get Instant Access to Expert-Tailored Solutions
See step-by-step solutions with expert insights and AI powered tools for academic success
Step: 2

Step: 3

Document Format ( 2 attachments)
6095c9d0d2fcd_26252.pdf
180 KBs PDF File
6095c9d0d2fcd_26252.docx
120 KBs Word File
Ace Your Homework with AI
Get the answers you need in no time with our AI-driven, step-by-step assistance
Get Started


