Answered step by step
Verified Expert Solution
Question
1 Approved Answer
The average oil price is listed as follow: Jan 31st, 2015???????$47.11 Aug 31st 2014??????.$100.05 Dec 31st 2014???????.$60.7 Based on the information provided above, what is
The average oil price is listed as follow:
Jan 31st, 2015???????$47.11
Aug 31st 2014??????.$100.05
Dec 31st 2014???????.$60.7
Based on the information provided above, what is the price elasticity of demand and supply for the dates mentioned above? You may compare your results with the values cited in the article and explain why the divergence in the values.

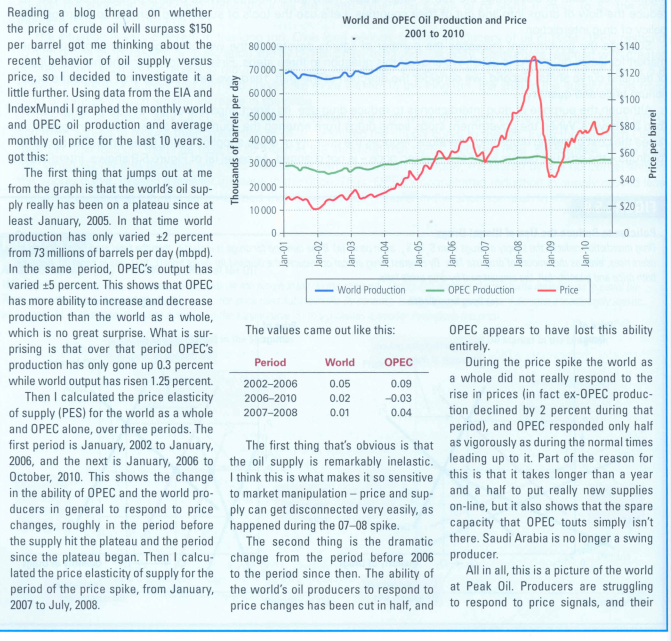
Reading a blog thread on whether the price of crude oil will surpass $150 per barrel got me thinking about the recent behavior of oil supply versus price, so I decided to investigate it a little further. Using data from the EIA and IndexMundi I graphed the monthly world and OPEC oil production and average monthly oil price for the last 10 years. I got this: The first thing that jumps out at me from the graph is that the world's oil sup- ply really has been on a plateau since at least January, 2005. In that time world production has only varied 2 percent from 73 millions of barrels per day (mbpd). In the same period, OPEC's output has varied +5 percent. This shows that OPEC has more ability to increase and decrease production than the world as a whole, which is no great surprise. What is sur- prising is that over that period OPEC's production has only gone up 0.3 percent while world output has risen 1.25 percent. Then I calculated the price elasticity of supply (PES) for the world as a whole and OPEC alone, over three periods. The first period is January, 2002 to January, 2006, and the next is January, 2006 to October, 2010. This shows the change in the ability of OPEC and the world pro- ducers in general to respond to price changes, roughly in the period before the supply hit the plateau and the period since the plateau began. Then I calcu- lated the price elasticity of supply for the period of the price spike, from January, 2007 to July, 2008. Thousands of barrels per day 80000 70 000- 60 000- 50 000 40 000 30 000 20000 10 000- 0- Jan-01- Jan-02- Period 2002-2006 2006-2010 2007-2008 World and OPEC Oil Production and Price 2001 to 2010 Jan-03- Jan-04- World Production The values came out like this: World 0.05 0.02 0.01 Jan-05- OPEC 0.09 -0.03 0.04 The first thing that's obvious is that the oil supply is remarkably inelastic. I think this is what makes it so sensitive to market manipulation - price and sup- ply can get disconnected very easily, as happened during the 07-08 spike. The second thing is the dramatic change from the period before 2006 to the period since then. The ability of the world's oil producers to respond to price changes has been cut in half, and Jan-06- Jan-07- Jan-08- OPEC Production Jan-09- Jan-10- Price + $140 $120 $100 $80 $60 $40 $20 Price per barrel 0sileg OPEC appears to have lost this ability entirely. During the price spike the world as a whole did not really respond to the rise in prices (in fact ex-OPEC produc- tion declined by 2 percent during that period), and OPEC responded only half as vigorously as during the normal times leading up to it. Part of the reason for this is that it takes longer than a year and a half to put really new supplies on-line, but it also shows that the spare capacity that OPEC touts simply isn't there. Saudi Arabia is no longer a swing producer. All in all, this is a picture of the world at Peak Oil. Producers are struggling to respond to price signals, and their
Step by Step Solution
★★★★★
3.54 Rating (151 Votes )
There are 3 Steps involved in it
Step: 1
August 2004 10005 quantity 20000000 December 2004 607 ...
Get Instant Access to Expert-Tailored Solutions
See step-by-step solutions with expert insights and AI powered tools for academic success
Step: 2

Step: 3

Ace Your Homework with AI
Get the answers you need in no time with our AI-driven, step-by-step assistance
Get Started


