Question
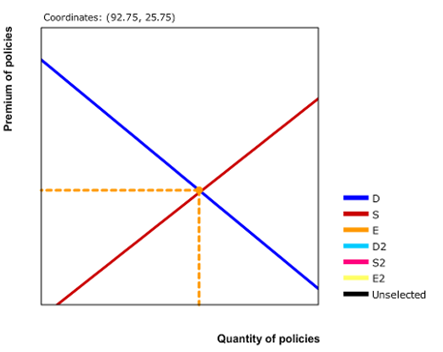
The following diagram represents the market demand and supply curve for insurance for British merchant ships. The original equilibrium quantity of policies and the equilibrium
The following diagram represents the market demand and supply curve for insurance for British merchant ships. The original equilibrium quantity of policies and the equilibrium premium price are indicated at point E on the graph. Assume that wealthy investors provide the insurance for the merchants' ships and that the ship merchants purchase these policies.
Part 1: Assume that large losses in the financial markets in Britain make investors skittish and more risk averse as a whole. Use the copy tool to show the effect of this change on the market for insurance. Label the new curve(s) as 02 or S2, as appropriate. Premium of policies
Part 2: Use the double drop line tool to show what happens to the equilibrium quantity of policies and equilibrium premium price. Label this new point E2.

Premium of policies Coordinates: (92.75, 25.75) Quantity of policies OSE D2 S2 E2 Unselected
Step by Step Solution
3.34 Rating (148 Votes )
There are 3 Steps involved in it
Step: 1
Investor are now skittish and mor...
Get Instant Access to Expert-Tailored Solutions
See step-by-step solutions with expert insights and AI powered tools for academic success
Step: 2

Step: 3

Ace Your Homework with AI
Get the answers you need in no time with our AI-driven, step-by-step assistance
Get Started


