

The following graph shows the aggregate supply (AS) and aggregate demand (AD) curves of a hypothetical economy.
Fantastic news! We've Found the answer you've been seeking!
Question:
The following graph shows the aggregate supply (AS) and aggregate demand (AD) curves of a hypothetical economy. Suppose that, in the absence of government intervention, the economy is in equilibrium at point E. Additionally, suppose that the price level corresponding to point K is considered too high, so the price level would be rising too rapidly if the economy were to move to point E, and that the government decides to step in to improve economic conditions. On the following graph, shift the relevant curve or curves to illustrate the result of the government intervention. 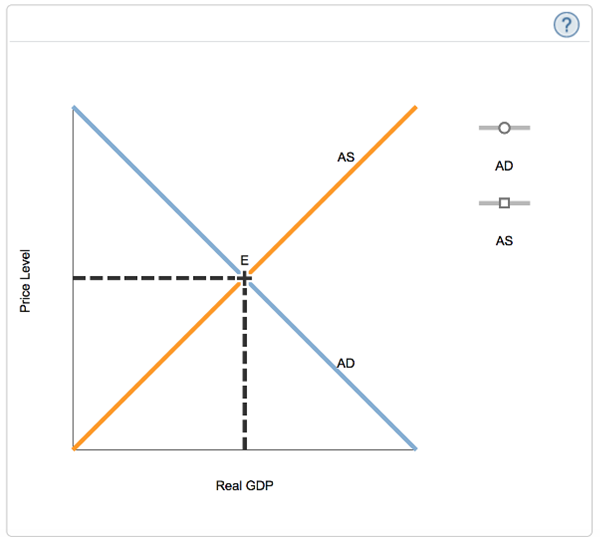 Which of the following policies could the government use to achieve the desired outcome? Check all that apply.
- Tax hikes
- Tax cuts
- Increases in government spending
- Reduction in government spending
Expert Answer:
Since current price level is too high Government should take steps that could help to reduce aggrega... View the full answer

Related Book For 
Posted Date:
