Question
Use the following set of independent variables ? SALTEACH, REVPUB, CLASS, and PECD ? to explain teacher turnover rates (TETURN). Do the full regression analysis.
Use the following set of independent variables ? SALTEACH, REVPUB, CLASS, and PECD ? to explain teacher turnover rates (TETURN).
Do the full regression analysis. This means that you have to:
Estimate (multiple) regression equation
Interpret the intercept.
Which independent variables appear to have a significant effect on the dependent variable? Why?
For significant independent variables interpret the magnitude (b) of the relationships.
Interpret the beta weights: which variables appear to be the most important predictors of the on teacher turnover rates?
R Square (what percentage of the variation in the dependent variable could you explain? What percentage did you fail to explain?)
Is your model overall significant?


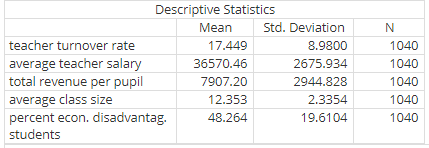
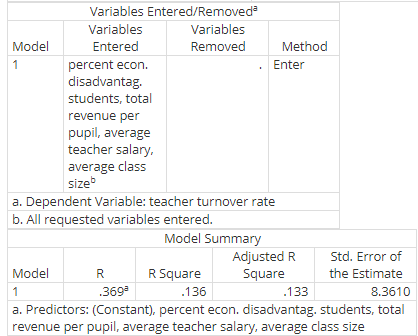
teacher turnover rate average teacher salary total revenue per pupil average class size Descriptive Statistics percent econ. disadvantag. students Mean 17.449 36570.46 7907.20 12.353 48.264 Std. Deviation 8.9800 2675.934 2944.828 2.3354 19.6104 N 1040 1040 1040 1040 1040 Pearson Correlation Sig. (1-tailed) N teacher turnover rate average teacher salary total revenue per pupil average class size percent econ. disadvantag. students teacher turnover rate average teacher salary total revenue per pupil average class size percent econ. disadvantag. students teacher turnover rate average teacher salary total revenue per pupil average class size percent econ. disadvantag. students Correlations teacher turnover rate 1.000 -317 .123 -.090 .078 .000 .000 .002 .006 1040 1040 1040 1040 1040 average teacher salary -.317 1.000 .025 .335 -.121 .000 .210 .000 .000 1040 1040 1040 1040 1040 total revenue per pupil .123 .025 1.000 -.580 .001 .000 .210 .000 .483 1040 1040 1040 1040 1040 average class size -.090 .335 -.580 1.000 -.119 .002 ,000 .000 .000 1040 1040 1040 1040 1040 percent econ. disadvantag. students .078 -.121 .001 -.119 1.000 .006 .000 .483 .000 1040 1040 1040 1040 1040 Model 1 Variables Entered/Removed Variables Entered percent econ. disadvantag. students, total revenue per pupil, average teacher salary, average class sizeb Variables Removed Method Enter a. Dependent Variable: teacher turnover rate b. All requested variables entered. Model Summary R Adjusted R Square Std. Error of the Estimate Model R Square 1 .369 .136 .133 8.3610 a. Predictors: (Constant), percent econ. disadvantag, students, total revenue per pupil, average teacher salary, average class size Model 1 Sum of Squares 11431.373 72353.725 83785.098 a. Dependent Variable: teacher turnover rate b. Predictors: (Constant), percent econ. disadvantag. students, total revenue per pupil, average teacher salary, average class size Model 1 ANOVA df Regression Residual Total 4 1035 1039 (Constant) average teacher salary total revenue per pupil average class size percent econ. disadvantag. students a. Dependent Variable: teacher turnover rate Mean Square 2857.843 69.907 Sig. F 40.881 .000 B Coefficients Unstandardized Coefficients 48.269 -.001 .001 .690 .025 Std. Error 3.858 .000 .000 .152 .013 Standardized Coefficients Beta Sig. 12.512.000 -.377 -11.747.000 .236 6.366 .000 4.546 .000 1.840 .066 t .179 .054
Step by Step Solution
3.32 Rating (143 Votes )
There are 3 Steps involved in it
Step: 1
Regression equation will be Teacher turnover rate 48269 0001 average teacher salary 0001 total revenue per pupil 0690 average class size 0025 percent ...
Get Instant Access to Expert-Tailored Solutions
See step-by-step solutions with expert insights and AI powered tools for academic success
Step: 2

Step: 3

Ace Your Homework with AI
Get the answers you need in no time with our AI-driven, step-by-step assistance
Get Started


