Answered step by step
Verified Expert Solution
Question
1 Approved Answer
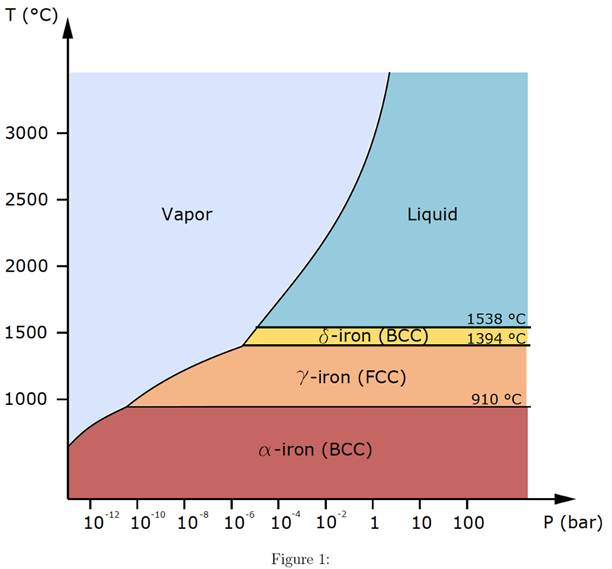
Using the phase diagram of iron below, draw the Gibbs free energy, enthalpy and entropy curves for two phases of your choice at a pressure
Using the phase diagram of iron below, draw the Gibbs free energy, enthalpy and entropy curves for two phases of your choice at a pressure of 1 bar. Make sure to label the temperature range correctly and the temperature at which a transition occurs.

T (C) 3000 2500 2000 1500 1000 Vapor -10 10 10 10 -8 6-iron (BCC) 7-iron (FCC) a-iron (BCC) Liquid -2 10 10 10 Figure 1: 1538 C 1394 C 910 C 1 10 100 P (bar)
Step by Step Solution
★★★★★
3.37 Rating (153 Votes )
There are 3 Steps involved in it
Step: 1
Gibbs free energy curves ...
Get Instant Access to Expert-Tailored Solutions
See step-by-step solutions with expert insights and AI powered tools for academic success
Step: 2

Step: 3

Document Format ( 2 attachments)
609af588e415c_31168.pdf
180 KBs PDF File
609af588e415c_31168.docx
120 KBs Word File
Ace Your Homework with AI
Get the answers you need in no time with our AI-driven, step-by-step assistance
Get Started


