

Question
You are given the annual data in Table 8-5 for the United States for the period 1971 to 1986. Consider the following aggregate demand function
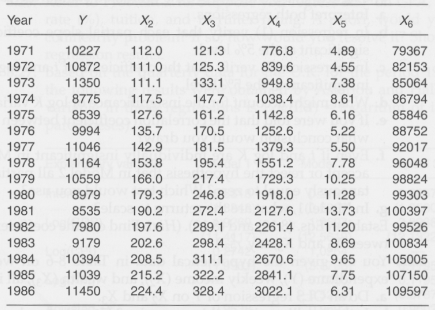
You are given the annual data in Table 8-5 for the United States for the period 1971 to 1986. Consider the following aggregate demand function for passenger cars:
InY i = B 1 + B 2 InX 2t + B 3 InX 3t + B 4 InX 4t + B 5 InX 5t + B 6 InX 6t + u t
where In = the natural log
a. What is the rationale for the introduction of both price indexes X 2 and X 3 ?
b. What might be the rationale for the introduction of the "employed civilian labor force" (X 6 ) in the demand function?
c. How would you interpret the various partial slope coefficients?
d. Obtain OLS estimates of the preceding model.
DEMAND FOR NEW PASSENGER CARS IN
THE UNITED STATES, 1971 TO 1986
Year 1971 1972 Y 10227 112.0 121.3 10872 111.0 125.3 1973 11350 111.1 133.1 1974 8775 117.5 8539 127.6 9994 135.7 1975 1976 1977 11046 1978 11164 1979 10559 X 19808979 1983 1984 1985 1986 X3 142.9 181.5 153.8 195.4 166.0 217.4 179.3 246.8 1981 8535 190.2 272.4 272.4 198205 7980 197.6 289.1 9179 202.6 298.4 10394 208.5 311.1 11039 215.2 322.2 11450 224.4 328.4 X4 776.8 839.6 949.8 147.7 1038.4 161.2 1142.8 170.5 1252.6 1379.3 1551.2 1729.3 1918.0 2127.6 2261.4 2428.1 2670.6 2841.1 3022.1 X5 4.89 4.55 7.38 8.61 6.16 5.22 5.50 7.78 10.25 11.28 13.73 11.20 X6 79367 82153 85064 86794 85846 88752 92017 96048 98824 99303 100397 99526 8.699 100834 9.65 105005 7.75 107150 6.31 109597
Step by Step Solution
3.47 Rating (147 Votes )
There are 3 Steps involved in it
Step: 1
a X 2 is a product specific price index whereas X 3 is the general price index It is possible that t...
Get Instant Access to Expert-Tailored Solutions
See step-by-step solutions with expert insights and AI powered tools for academic success
Step: 2

Step: 3
Document Format ( 2 attachments)
6097527240d11_27734.pdf
180 KBs PDF File
6097527240d11_27734.docx
120 KBs Word File
Ace Your Homework with AI
Get the answers you need in no time with our AI-driven, step-by-step assistance
Get Started
Essentials of Econometrics
Authors: Damodar Gujarati, Dawn Porter
4th edition
73375845, 978-0071276078, 71276076, 978-0073375847