Capital Structure Decisions and Degree of Leverage After performing the financial ratio analysis, assessment of the data revealed that Flagstaff Inc. uses less debt than
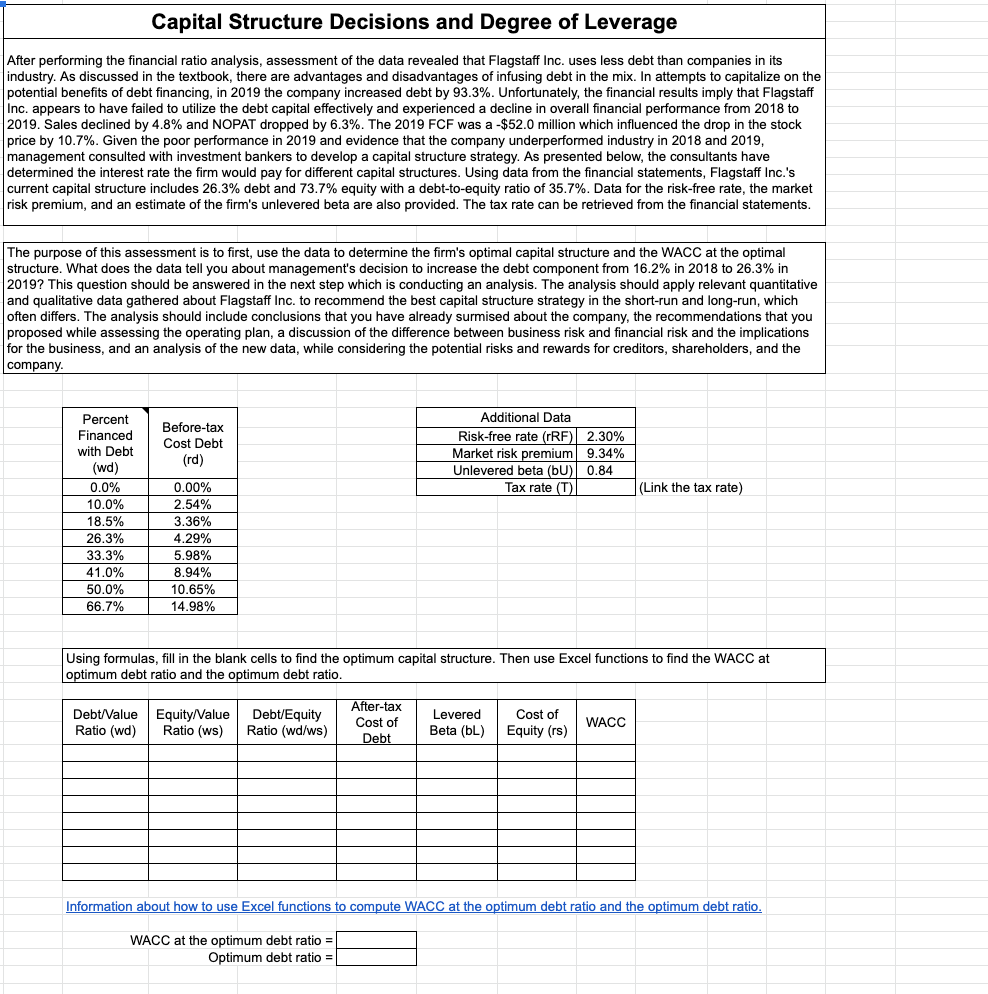
Capital Structure Decisions and Degree of Leverage After performing the financial ratio analysis, assessment of the data revealed that Flagstaff Inc. uses less debt than companies in its industry. As discussed in the textbook, there are advantages and disadvantages of infusing debt in the mix. In attempts to capitalize on the potential benefits of debt financing, in 2019 the company increased debt by 93.3%. Unfortunately, the financial results imply that Flagstaff Inc. appears to have failed to utilize the debt capital effectively and experienced a decline in overall financial performance from 2018 to 2019. Sales declined by 4.8% and NOPAT dropped by 6.3%. The 2019 FCF was a -$52.0 million which influenced the drop in the stock price by 10.7%. Given the poor performance in 2019 and evidence that the company underperformed industry in 2018 and 2019, management consulted with investment bankers to develop a capital structure strategy. As presented below, the consultants have determined the interest rate the firm would pay for different capital structures. Using data from the financial statements, Flagstaff Inc.'s current capital structure includes 26.3% debt and 73.7% equity with a debt-to-equity ratio of 35.7%. Data for the risk-free rate, the market risk premium, and an estimate of the firm's unlevered beta are also provided. The tax rate can be retrieved from the financial statements. The purpose of this assessment is to first, use the data to determine the firm's optimal capital structure and the WACC at the optimal |structure. What does the data tell you about management's decision to increase the debt component from 16.2% in 2018 to 26.3% in 2019? This question should be answered in the next step which is conducting an analysis. The analysis should apply relevant quantitative and qualitative data gathered about Flagstaff Inc. to recommend the best capital structure strategy in the short-run and long-run, which often differs. The analysis should include conclusions that you have already surmised about the company, the recommendations that you proposed while assessing the operating plan, a discussion of the difference between business risk and financial risk and the implications for the business, and an analysis of the new data, while considering the potential risks and rewards for creditors, shareholders, and the company. Percent Additional Data Finance Before-tax Risk-free rate (rRF) | 2.30% with Debt Cost Debt (wd) (rd) Market risk premium |9.34% Unlevered beta (bU) 0.84 0.0% 0.00% Tax rate (T) (Link the tax rate) 0.0% 2.54% 18.5% 3.369 26.3% 4.29% 33.3% 5.98% 41.0% 8.94% 50.0% 0.65% 66.7% 14.98% Using formulas, fill in the blank cells to find the optimum capital structure. Then use Excel functions to find the WACC at optimum debt ratio and the optimum debt ratio. Debt/Value Equity/Value Debt/Equity After-tax Levered Cost of Ratio (wd/ws) Debt Beta (bL) WACC Ratio (wd) Ratio (ws) Cost of Equity (rs) Information about how to use Excel functions to compute WACC at the optimum debt ratio and the optimum debt ratio. WACC at the optimum debt ratio = Optimum debt ratio =
Step by Step Solution
There are 3 Steps involved in it
Step: 1
Get Instant Access to Expert-Tailored Solutions
See step-by-step solutions with expert insights and AI powered tools for academic success
Step: 2
Step: 3
Ace Your Homework with AI
Get the answers you need in no time with our AI-driven, step-by-step assistance