Table 3 Music Sentiment and Stock Market Returns. This table reports the regression estimates from Eq. (3) from January 1, 2017, to December 31, 2020.
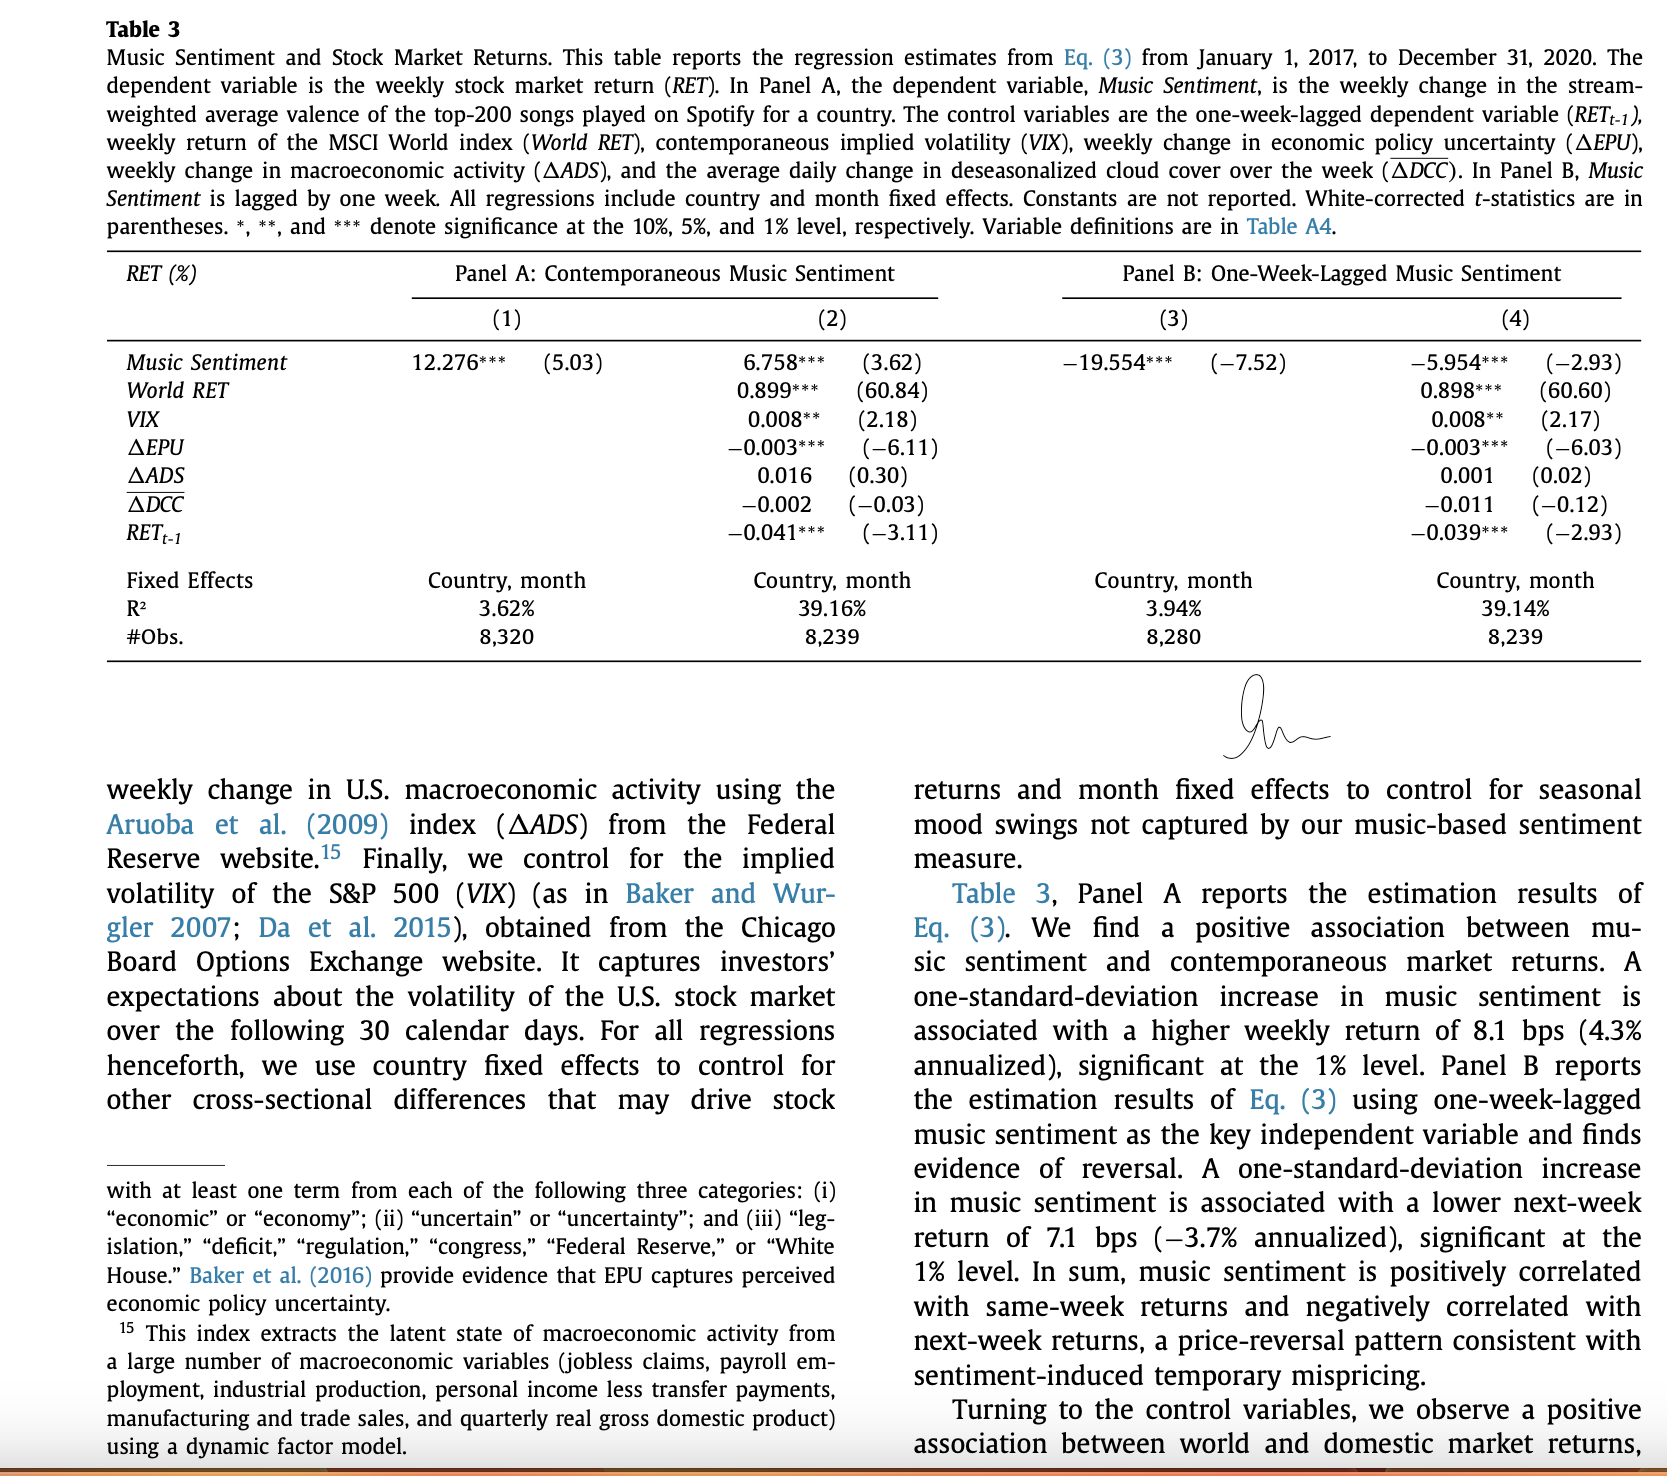
Table 3 Music Sentiment and Stock Market Returns. This table reports the regression estimates from Eq. (3) from January 1, 2017, to December 31, 2020. The dependent variable is the weekly stock market return (RET). In Panel A, the dependent variable, Music Sentiment, is the weekly change in the stream- weighted average valence of the top-200 songs played on Spotify for a country. The control variables are the one-week-lagged dependent variable (RETt-1) weekly return of the MSCI World index (World RET), contemporaneous implied volatility (VIX), weekly change in economic policy uncertainty (AEPU), weekly change in macroeconomic activity (AADS), and the average daily change in deseasonalized cloud cover over the week (ADCC). In Panel B, Music Sentiment is lagged by one week. All regressions include country and month fixed effects. Constants are not reported. White-corrected t-statistics are in parentheses. *, **, and *** denote significance at the 10%, 5%, and 1% level, respectively. Variable definitions are in Table A4 RET (%) Panel A: Contemporaneous Music Sentiment Panel B: One-Week-Lagged Music Sentiment (1) (2) 3) (4) Music Sentiment 12.276*** (5.03) 6.758** * (3.62) -19.554*** (-7.52) -5.954*** (-2.93) World RET 0.899** 60.84) 0.898** 60.60) VIX 0.008** (2.18) 0.008* (2.17) AEPU 0.003*** (-6.11) -0.003* * * (-6.03) AADS 0.016 (0.30) 0.001 (0.02) ADCC -0.002 (-0.03) -0.011 (-0.12) RETt-1 -0.041*** (-3.11) -0.039*** (-2.93) Fixed Effects Country, month Country, month Country, month Country, month R2 3.62% 39.169 3.94% $9.14% #Obs 3,320 3,239 3,28 3,239 weekly change in U.S. macroeconomic activity using the returns and month fixed effects to control for seasonal Aruoba et al. (2009) index (AADS) from the Federal mood swings not captured by our music-based sentiment Reserve website. Finally, we control for the implied measure. volatility of the S&P 500 (VIX) (as in Baker and Wur- Table 3, Panel A reports the estimation results of gler 2007; Da et al. 2015), obtained from the Chicago Eq. (3). We find a positive association between mu- Board Options Exchange website. It captures investors' sic sentiment and contemporaneous market returns. A expectations about the volatility of the U.S. stock market one-standard-deviation increase in music sentiment is over the following 30 calendar days. For all regressions associated with a higher weekly return of 8.1 bps (4.3% henceforth, we use country fixed effects to control for annualized), significant at the 1% level. Panel B reports other cross-sectional differences that may drive stock the estimation results of Eq. (3) using one-week-lagged music sentiment as the key independent variable and finds evidence of reversal. A one-standard-deviation increase with at least one term from each of the following three categories: (i) "economic" or "economy"; (ii) "uncertain" or "uncertainty"; and (iii) "leg- in music sentiment is associated with a lower next-week islation," "deficit," "regulation," "congress," "Federal Reserve," or "White return of 7.1 bps (-3.7% annualized), significant at the House." Baker et al. (2016) provide evidence that EPU captures perceived 1% level. In sum, music sentiment is positively correlated economic policy uncertainty. with same-week returns and negatively correlated with 15 This index extracts the latent state of macroeconomic activity from next-week returns, a price-reversal pattern consistent with a large number of macroeconomic variables (jobless claims, payroll em- ployment, industrial production, personal income less transfer payments, sentiment-induced temporary mispricing manufacturing and trade sales, and quarterly real gross domestic product) Turning to the control variables, we observe a positive using a dynamic factor model. association between world and domestic market returns
Step by Step Solution
There are 3 Steps involved in it
Step: 1
Get Instant Access to Expert-Tailored Solutions
See step-by-step solutions with expert insights and AI powered tools for academic success
Step: 2
Step: 3
Ace Your Homework with AI
Get the answers you need in no time with our AI-driven, step-by-step assistance