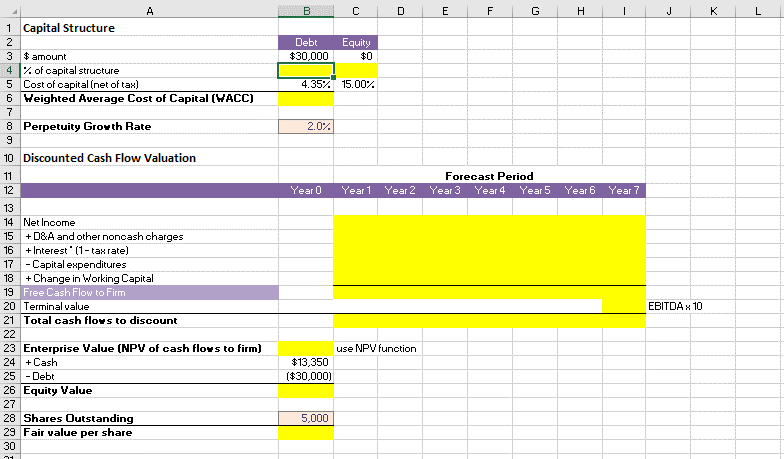
A B C E F G H J K L 1 Capital Structure N Debt Equity $ amount $30,000 $0 4 X of capital structure
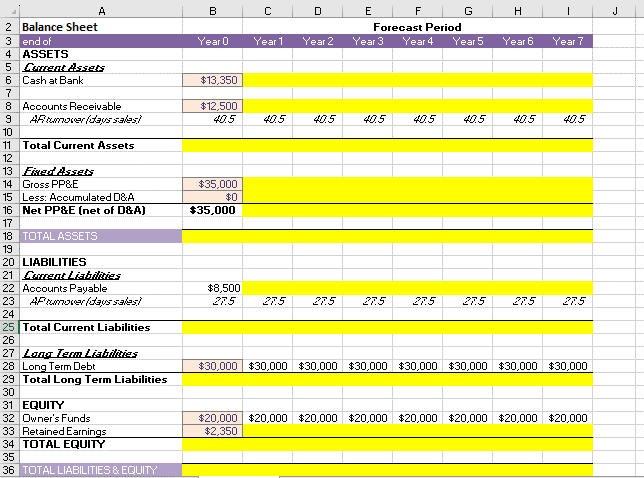
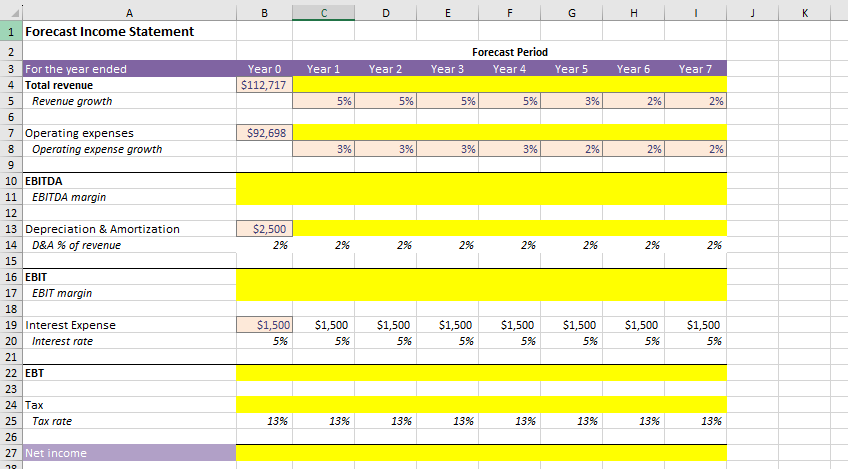
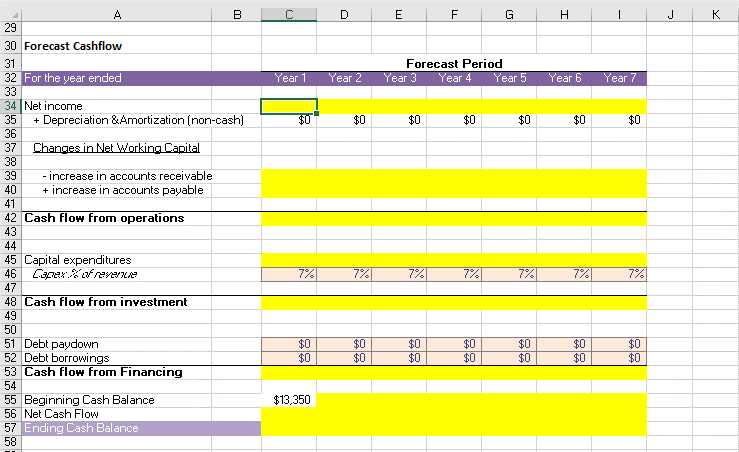
A B C E F G H J K L 1 Capital Structure N Debt Equity $ amount $30,000 $0 4 X of capital structure 5 Cost of capital (net of tax) 4.35% 15.00% 6 Weighted Average Cost of Capital (WACC] -J 8 Perpetuity Growth Rate 2.0% LO 10 Discounted Cash Flow Valuation 11 Forecast Period 12 Year 0 Year1 Year2 Year 3 Year4 Year5 Year6 Year 7 13 14 Net Income 15 + D&A and other noncash charges 16 + Interest " (1- tax rate) 17 - Capital expenditures 18 + Change in Working Capital 19 Free Cash Flow to Firm 20 Terminal value EBITDA * 10 21 Total cash flows to discount 22 23 Enterprise Value (NPV of cash flows to firm] use NPV function 24 + Cash $13,350 25 - Debt ($30,000) 26 Equity Value 27 28 Shares Outstanding 5,000 29 Fair value per share 30A B C E F G H J Balance Sheet Forecast Period end of Year O Year 1 Year 2 Year 3 Year 4 Year 5 Year 6 Year 7 4 ASSETS Curent Asse's Cash at Bank $13.350 Accounts Receivable $12.500 40.5 40.5 40.5 40.5 40.5 40.5 40.5 40.5 10 11 Total Current Assets 12 13 Fined Assess 14 Gross PP&.E $35,000 15 Less: Accumulated DB.A $0 16 Net PP&E (net of D&A] $35,000 17 18 TOTAL ASSETS 19 20 LIABILITIES 21 22 Accounts Payable $8,500 23 AFawnover /avs salas/ 27.5 275 24 25 Total Current Liabilities 26 27 Long Tam Liabilities 28 Long Term Debt $30,000 $30.000 $30.000 $30.000 $30.000 $30.000 $30.000 $30.000 29 Total Long Term Liabilities 30 31 EQUITY 32 Owner's Funds $20,000 $20,000 $20,000 $20,000 $20,000 $20,000 $20,000 $20,000 33 Retained Earnings $2.350 34 TOTAL EQUITY 35 36 TOTAL LIABILITIES & EQUITYA B C D E F G H L K 1 Forecast Income Statement 2 Forecast Period 3 For the year ended Year 0 Year 1 Year 2 Year 3 Year 4 Year 5 Year 6 Year 7 4 Total revenue $112,717 in Revenue growth 5% 5% 5%% 3% 2% 2% 6 7 Operating expenses $92,698 8 Operating expense growth 3% 3% 3% 3% 2% 2% 2% 9 10 EBITDA 11 EBITDA margin 12 13 Depreciation & Amortization 52,500 14 DEA % of revenue 29% 2% 29% 2% 2% 29% 2% 29% 15 16 EBIT 17 EBIT margin 18 19 Interest Expense $1,500 $1,500 $1,500 $1,500 $1,500 $1,500 $1,500 $1,500 20 Interest rate 5% 5% 5% 5% 5% 5% 5% 5% 21 22 EBT 23 24 Tax 25 Tax rate 13% 13% 13% 13% 13% 13% 13% 13% 26 27 Net incomeB C D E F G H J K 29 30 Forecast Cashflow 31 Forecast Period 32 For the year ended Year 1 Year 2 Year 3 Year 4 Year 5 Year 6 Year 7 33 34 Net income 35 + Depreciation &Amortization (non-cash) $0 $0 $0 $0 $0 $0 36 37 Changes in Net Working Capital 38 39 - Increase in accounts receivable 40 + increase in accounts payable 41 42 Cash flow from operations 43 44 45 Capital expenditures 46 7% 7% 7 7% 7% 7% 7% 47 48 Cash flow from investment 49 50 51 Debt paydown $0 $0 $0 $0 $0 $0 $0 52 Debt borrowings $0 $0 $0 $0 $0 53 Cash flow from Financing 54 55 Beginning Cash Balance $13,350 56 Net Cash Flow 57 Ending Cash Balance 58
Step by Step Solution
There are 3 Steps involved in it
Step: 1
Get Instant Access to Expert-Tailored Solutions
See step-by-step solutions with expert insights and AI powered tools for academic success
Step: 2
Step: 3
Ace Your Homework with AI
Get the answers you need in no time with our AI-driven, step-by-step assistance