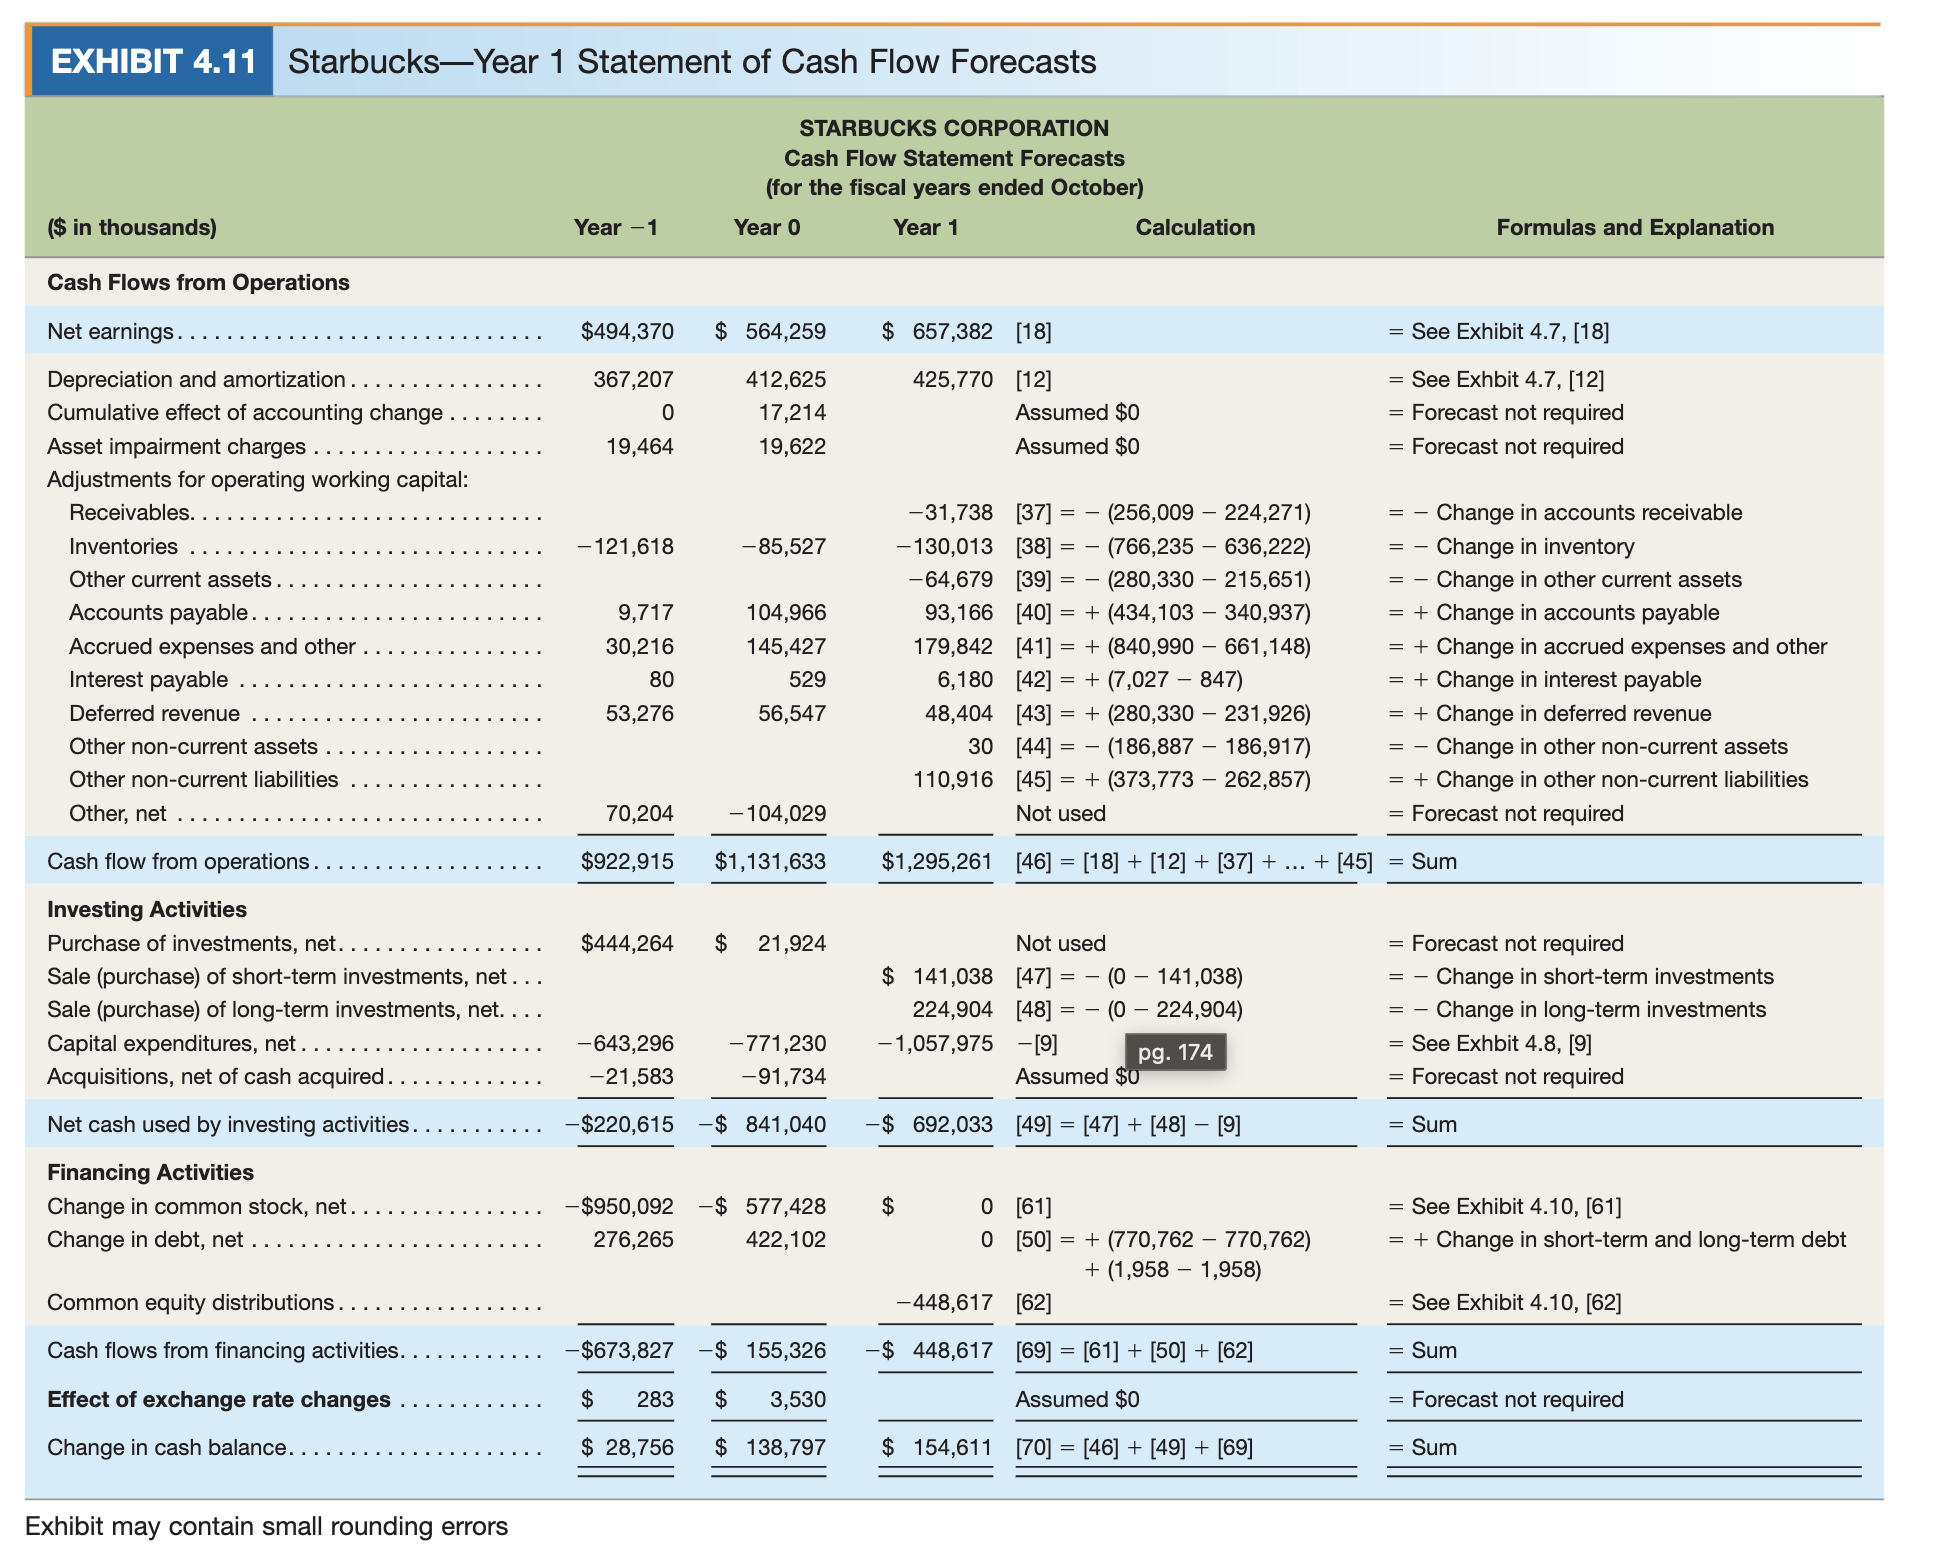
EXHIBIT 4.11 Starbucks-Year 1 Statement of Cash Flow Forecasts STARBUCKS CORPORATION Cash Flow Statement Forecasts (for the fiscal years ended October) ($ in thousands) Year
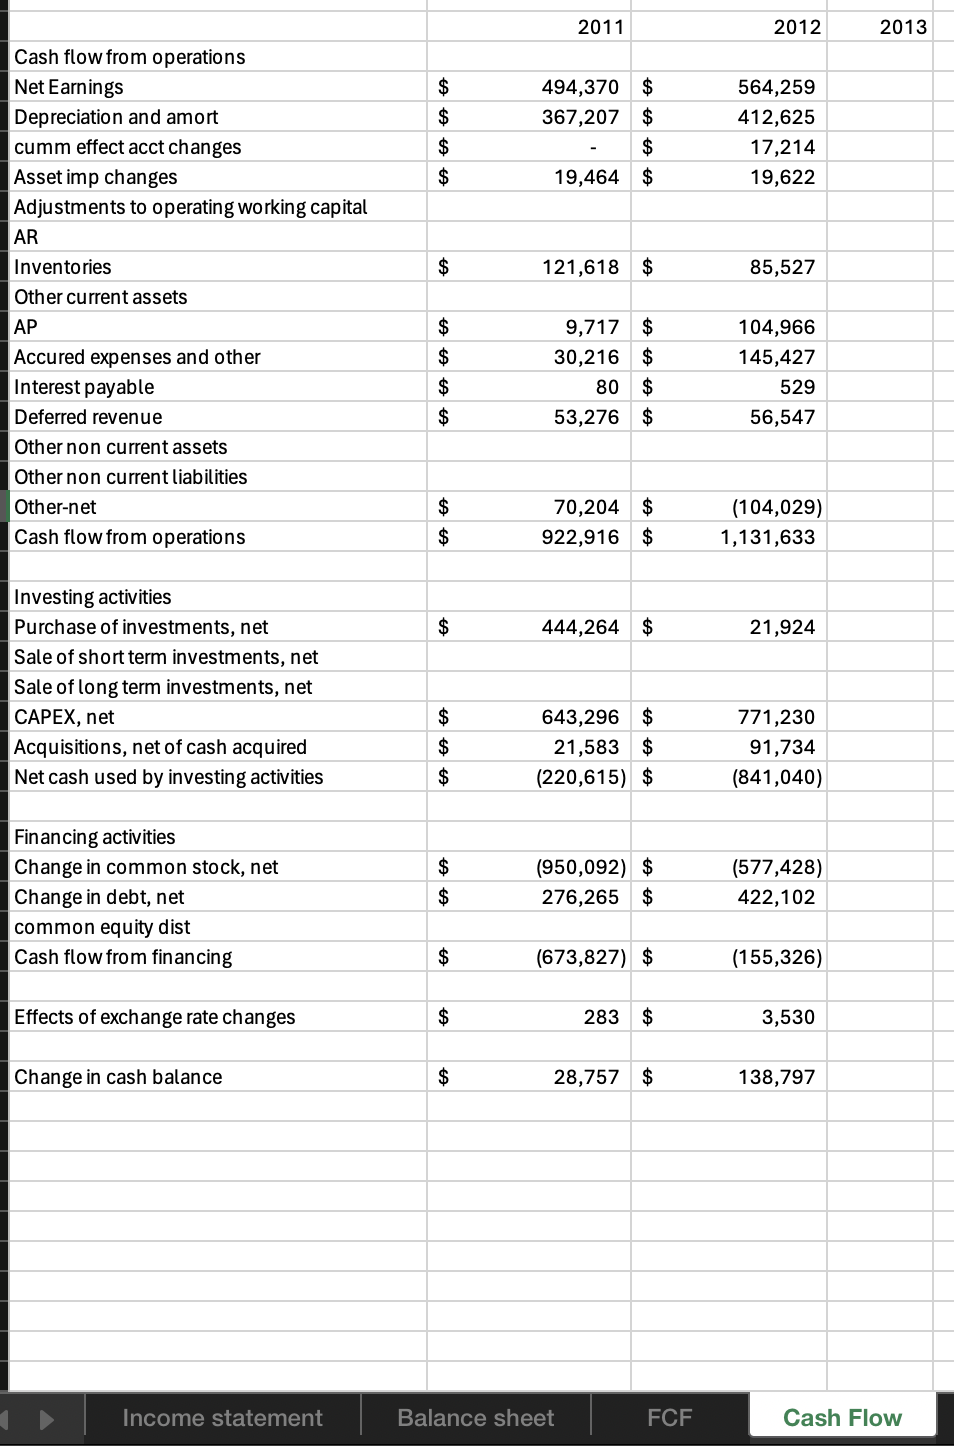
EXHIBIT 4.11 Starbucks-Year 1 Statement of Cash Flow Forecasts STARBUCKS CORPORATION Cash Flow Statement Forecasts (for the fiscal years ended October) ($ in thousands) Year -1 Year 0 Year 1 Calculation Formulas and Explanation Cash Flows from Operations Net earnings . . . $494,370 $ 564,259 $ 657,382 [18] = See Exhibit 4.7, [18] Depreciation and amortization . . . . . . . . 367,207 412,625 425,770 [12] = See Exhbit 4.7, [12] Cumulative effect of accounting change . . . . . . . . 17,214 Assumed $0 = Forecast not required Asset impairment charges . . . . . . . . 19,464 19,622 Assumed $0 = Forecast not required Adjustments for operating working capital: Receivables. . . . . . . . . . . . . . . . . . . .. -31,738 [37] = - (256,009 - 224,271) = - Change in accounts receivable Inventories -121,618 -85,527 -130,013 [38] = - (766,235 - 636,222) = - Change in inventory Other current assets . . . . . . . . . . . . . . . . . . . . . . 64,679 [39] = - (280,330 - 215,651) Change in other current assets Accounts payable . . .. 9,717 104,966 93, 166 [40] = + (434,103 - 340,937) = + Change in accounts payable Accrued expenses and other . 30,216 145,427 179,842 [41] = + (840,990 - 661,148) = + Change in accrued expenses and other Interest payable 80 529 6,180 [42] = + (7,027 - 847) = + Change in interest payable Deferred revenue 53,276 56,547 48,404 [43] = + (280,330 - 231,926) = + Change in deferred revenue Other non-current assets 30 [44] = - (186,887 - 186,917) = - Change in other non-current assets Other non-current liabilities . . . . . 110,916 [45] = + (373,773 - 262,857) = + Change in other non-current liabilities Other, net . . . . 70,204 -104,029 Not used = Forecast not required Cash flow from operations . . . . . ... . . . . . . . $922,915 $1, 131,633 $1,295,261 [46] = [18] + [12] + [37] + ... + [45] = Sum Investing Activities Purchase of investments, net. . . . . . . . . . . . . . ... $444,264 $ 21,924 Not used = Forecast not required Sale (purchase) of short-term investments, net . . . $ 141,038 [47] = - (0 - 141,038) = - Change in short-term investments Sale (purchase) of long-term investments, net. . . . 224,904 [48] = - (0 - 224,904) = - Change in long-term investments Capital expenditures, net . . . .. . . . . . . . . . . . .. .. -643,296 -771,230 -1,057,975 -[9] pg. 174 = See Exhbit 4.8, [9] Acquisitions, net of cash acquired . . . . . . . . . . .. . -21,583 -91,734 Assumed $0 = Forecast not required Net cash used by investing activities. . . . . . . . . . . -$220,615 $ 841,040 $ 692,033 [49] = [47] + [48] - [9] = Sum Financing Activities Change in common stock, net. . . . . . . . . . . . . . . . $950,092 $ 577,428 $ 0 [61] = See Exhibit 4.10, [61] Change in debt, net . . . . . . . . . . . . . . . . . . . . . . 276,265 422,102 0 [50] = + (770,762 - 770,762) = + Change in short-term and long-term debt + (1,958 - 1,958) Common equity distributions . . . . . . . . . . . . . . . . . -448,617 = See Exhibit 4.10, [62] Cash flows from financing activities. $673,827 -$ 155,326 -$ 448,617 [69] = [61] + [50] + [62] = Sum Effect of exchange rate changes $ 283 $ 3,530 Assumed $0 = Forecast not required Change in cash balance. .. $ 28,756 138,797 $ 154,611 [70] = [46] + [49] + [69] Sum Exhibit may contain small rounding errorsCash flow from operations Net Earnings Depreciation and amort cumm effect acct changes Assetimp changes Adjustments to operating working capital AR Inventories Other current assets AP Accured expenses and other Interest payable Deferred revenue Other non current assets Other non current liabilities Other-net Cash flow from operations Investing activities Purchase of investments, net Sale of short term investments, net Sale of long term investments, net CAPEX, net Acquisitions, net of cash acquired Net cash used by investing activities Financing activities Changein common stock, net Change in debt, net common equity dist Cash flow from financing Effects of exchange rate changes Change in cash balance 84 6 & 6 & 2011 494,370 367,207 19,464 121,618 9,717 30,216 80 53,276 70,204 922,916 444,264 643,296 21,583 (220,615) (950,092) 276,265 (673,827) 283 28,757 84 6 & 6 & 2012 2013 564,259 412,625 17,214 19,622 85,527 104,966 145,427 529 56,547 (104,029) 1,131,633 21,924 771,230 91,734 (841,040) (577,428) 422,102 (155,326) 3,530 138,797 Cash Flow
Step by Step Solution
There are 3 Steps involved in it
Step: 1
Get Instant Access to Expert-Tailored Solutions
See step-by-step solutions with expert insights and AI powered tools for academic success
Step: 2
Step: 3
Ace Your Homework with AI
Get the answers you need in no time with our AI-driven, step-by-step assistance