CASE STUDY HEARTLAND BANK HOLDING COMPANY Sandra Gonzales was recently hired by the vestigate in order to focus her attention on Heartland Bank Holding Company
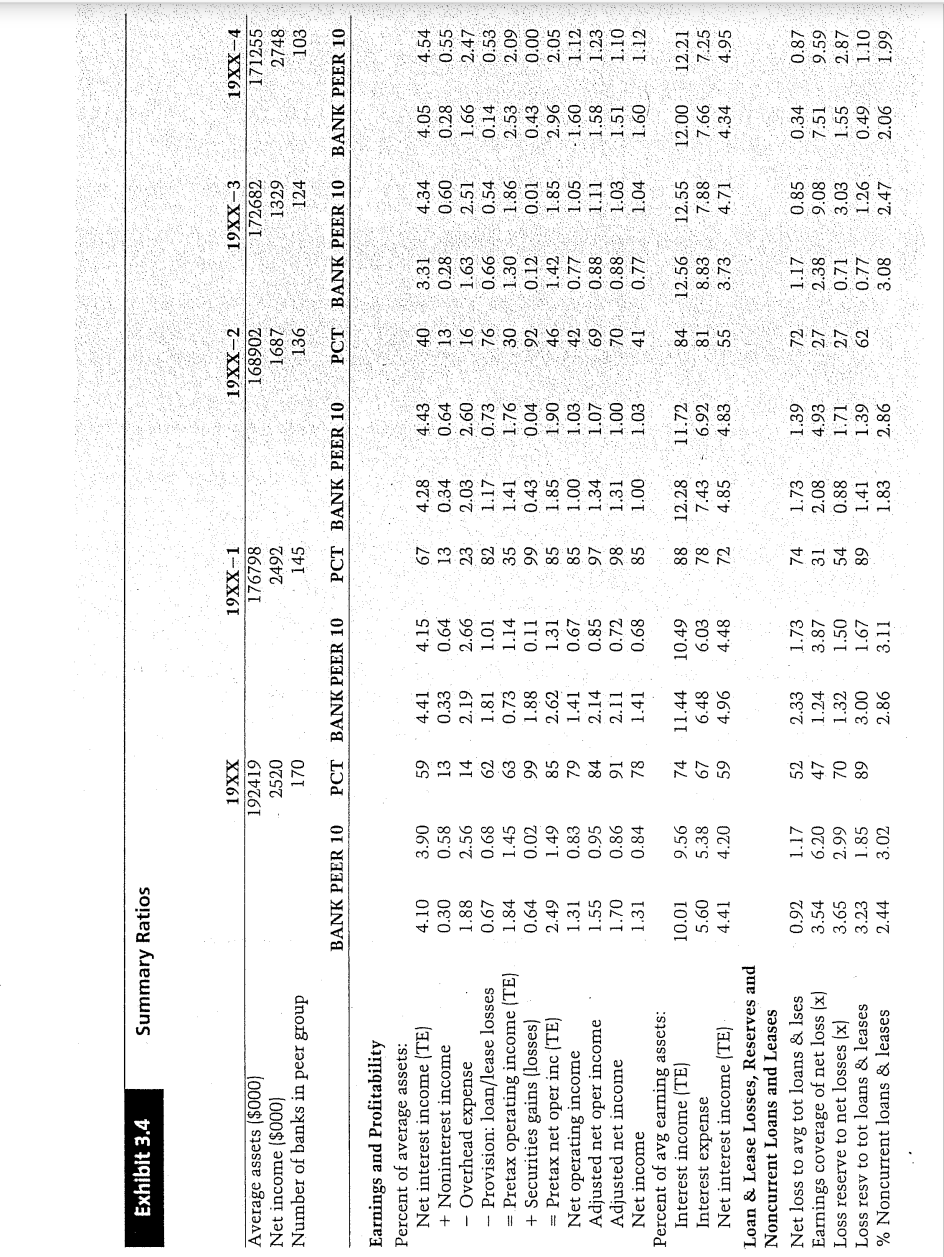
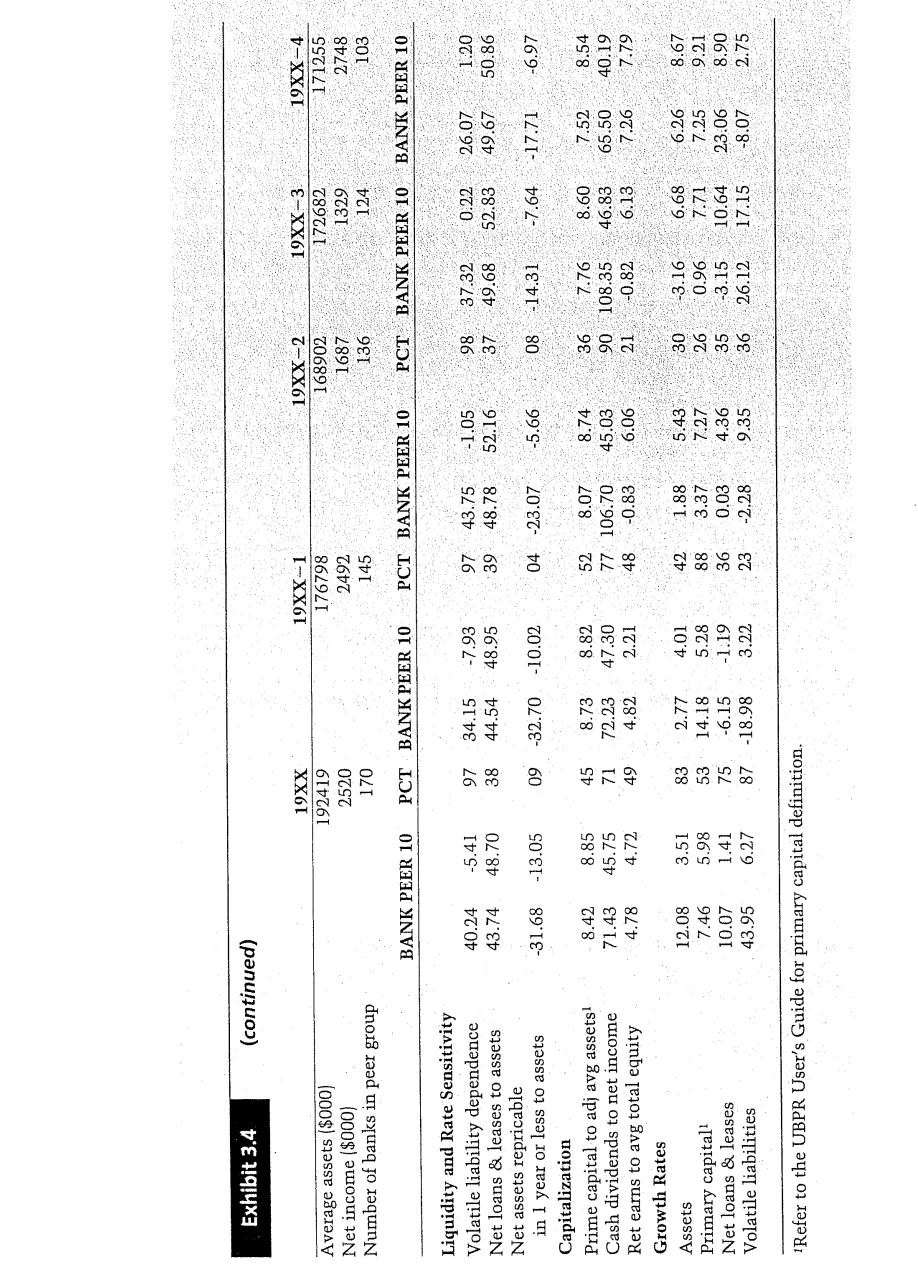
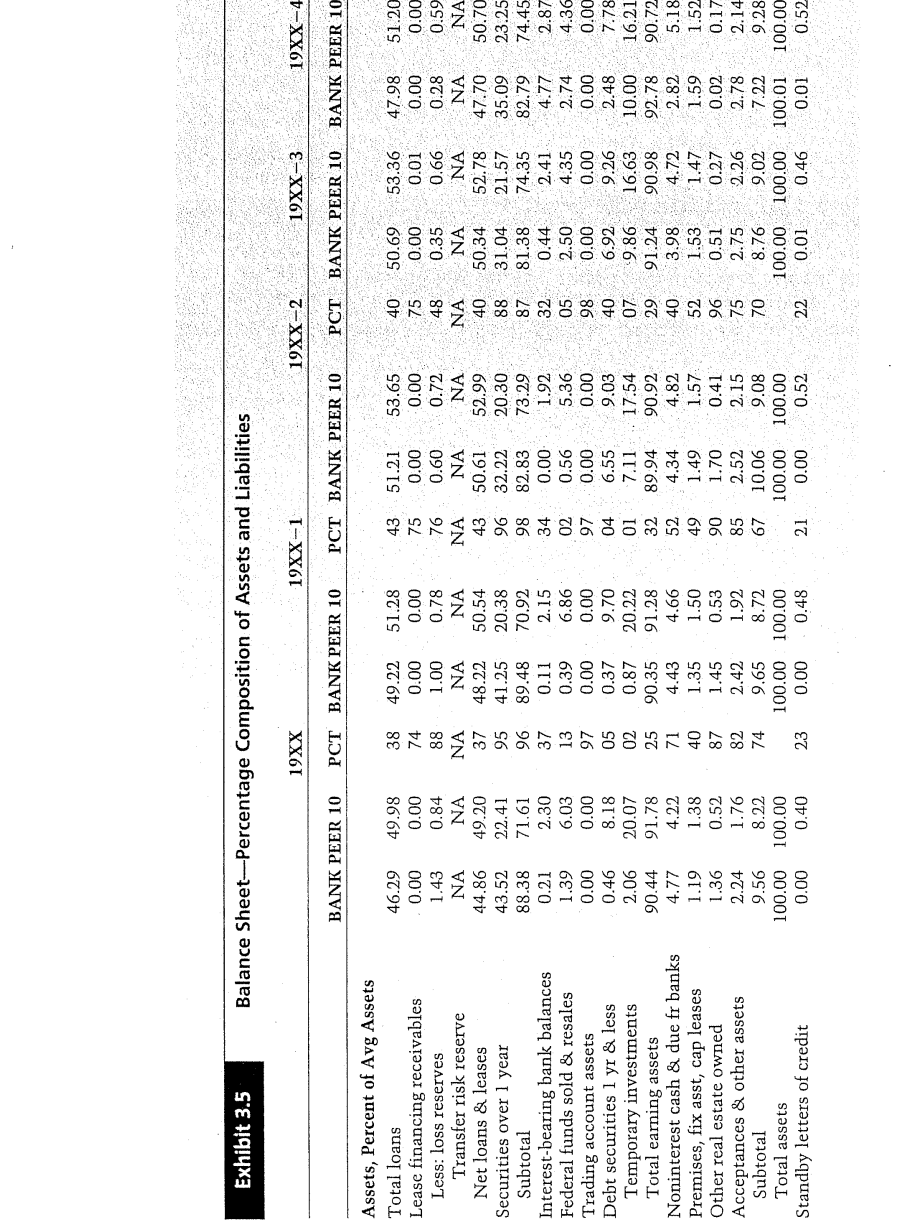
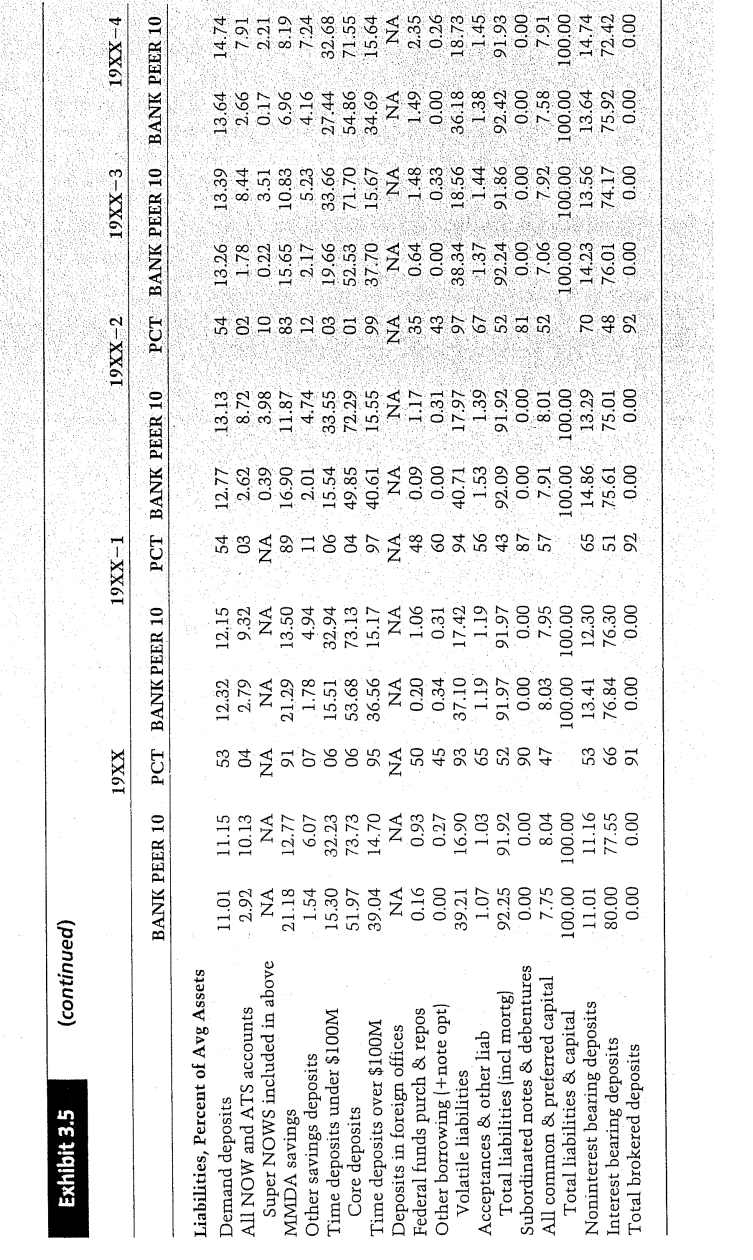
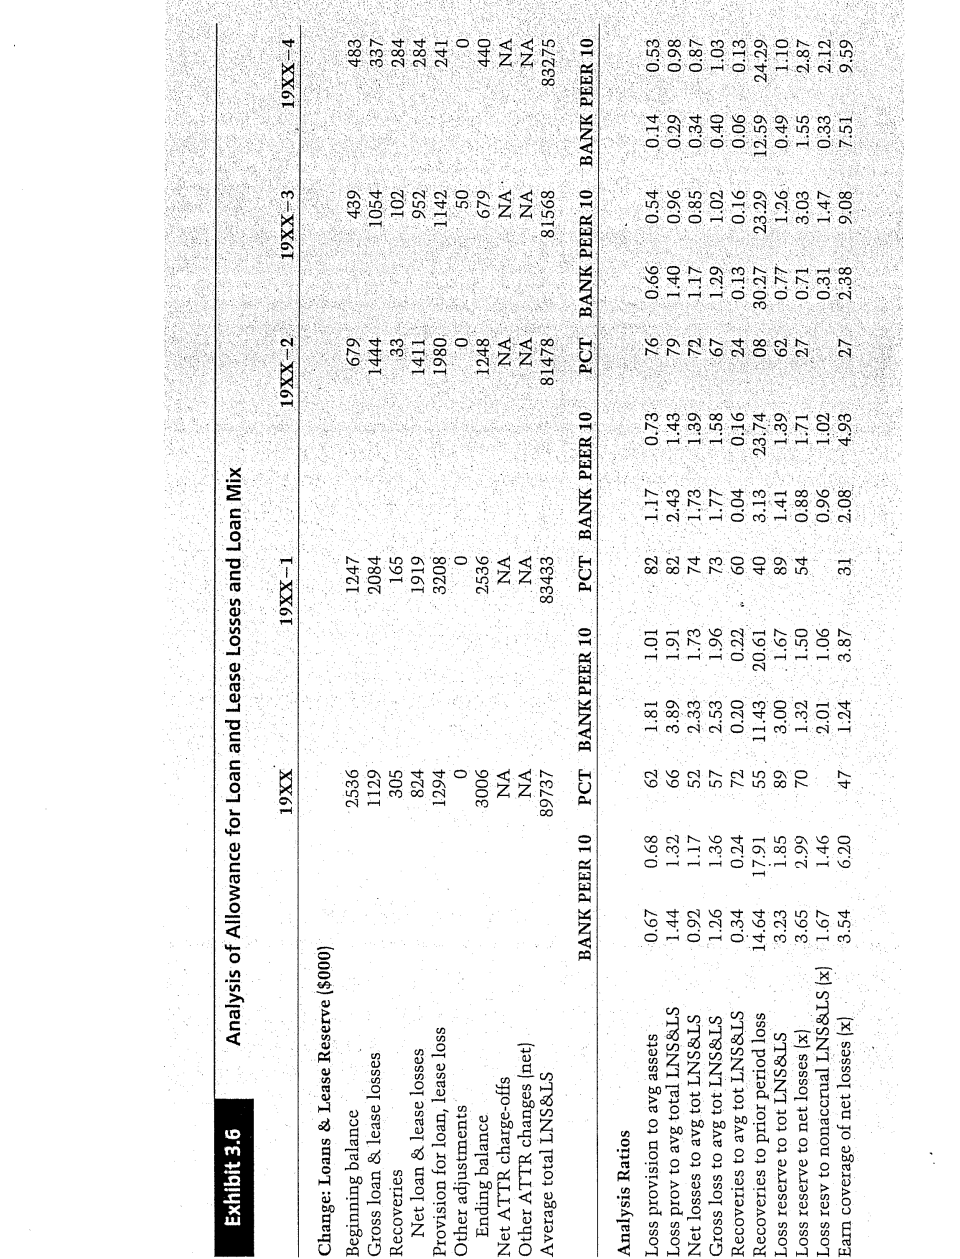
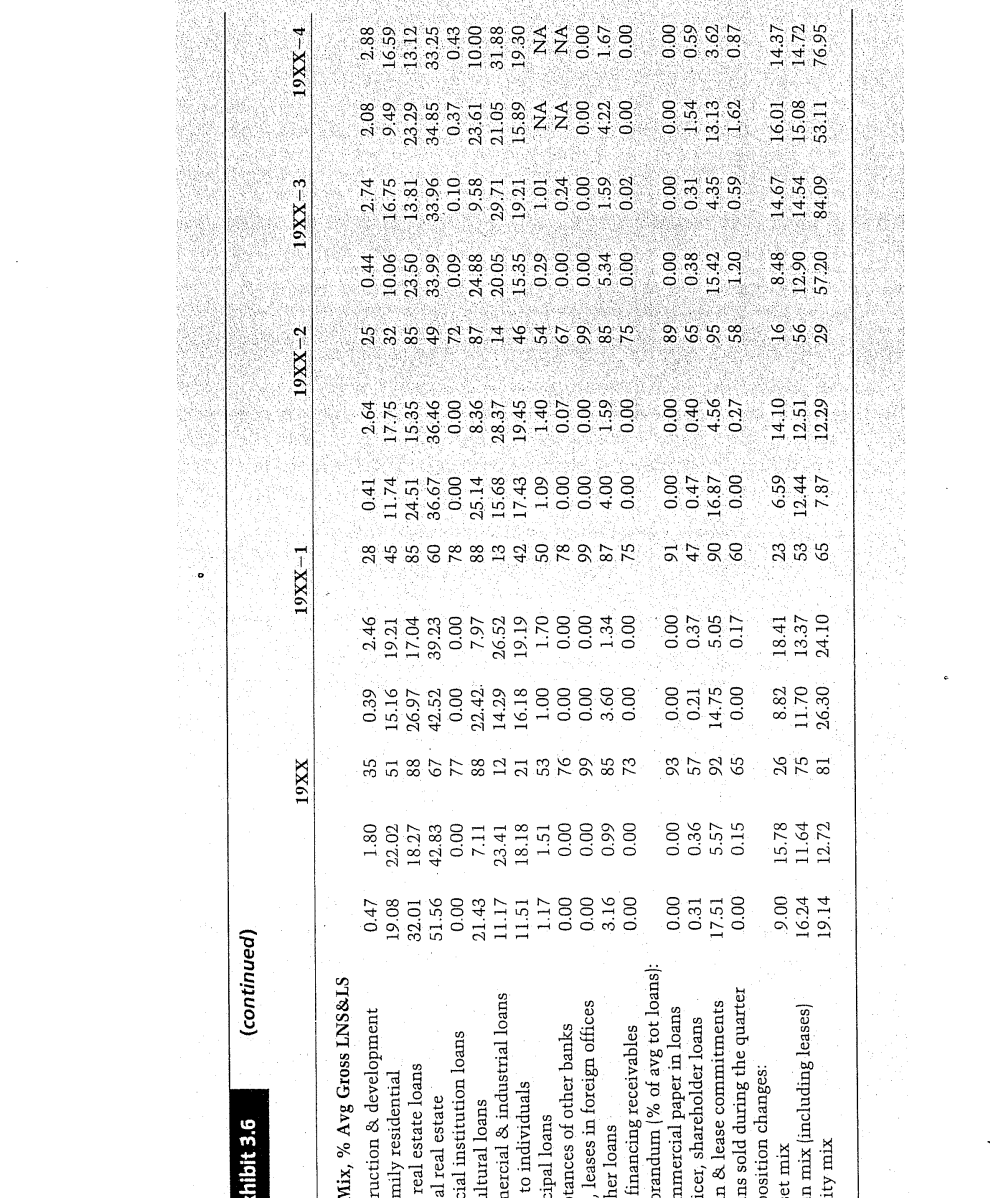
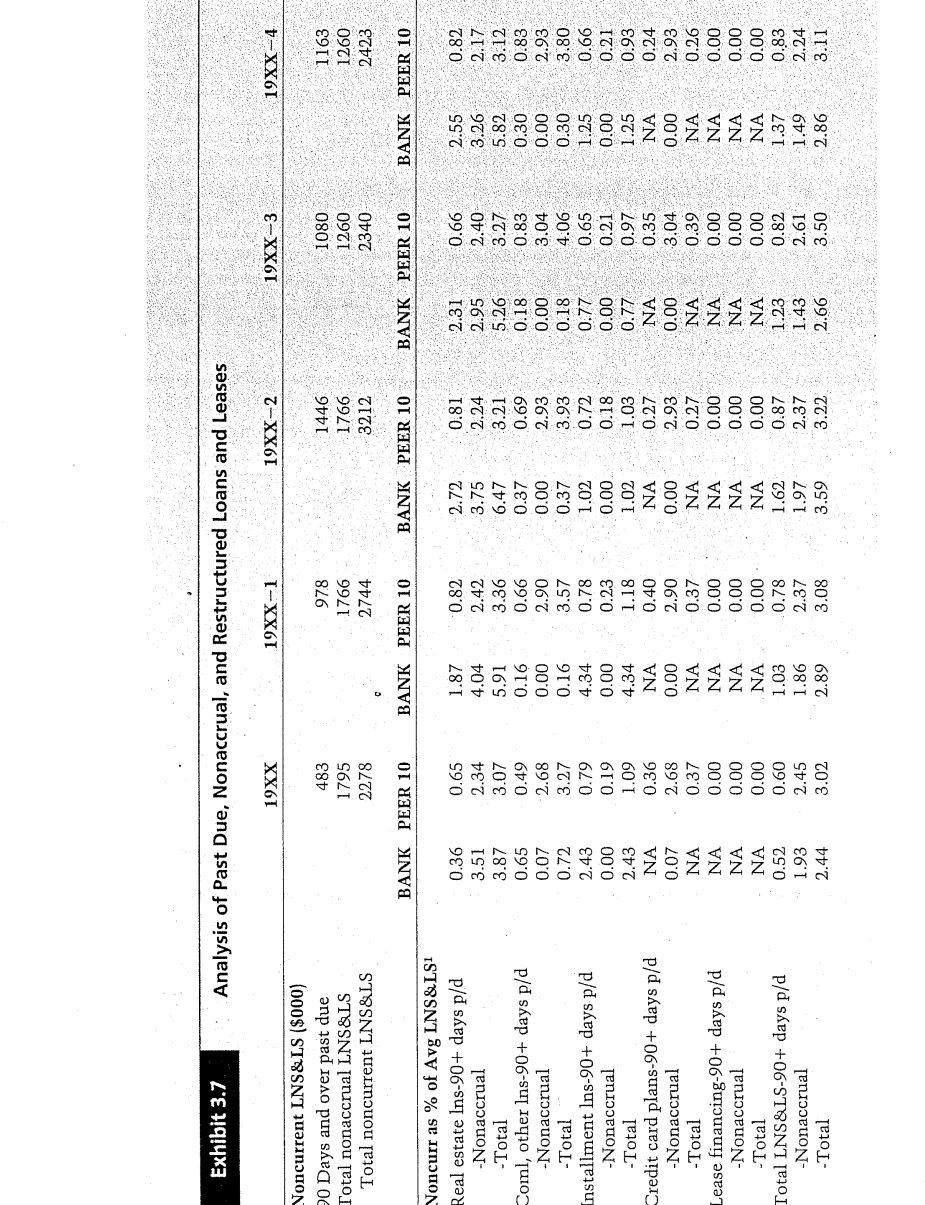
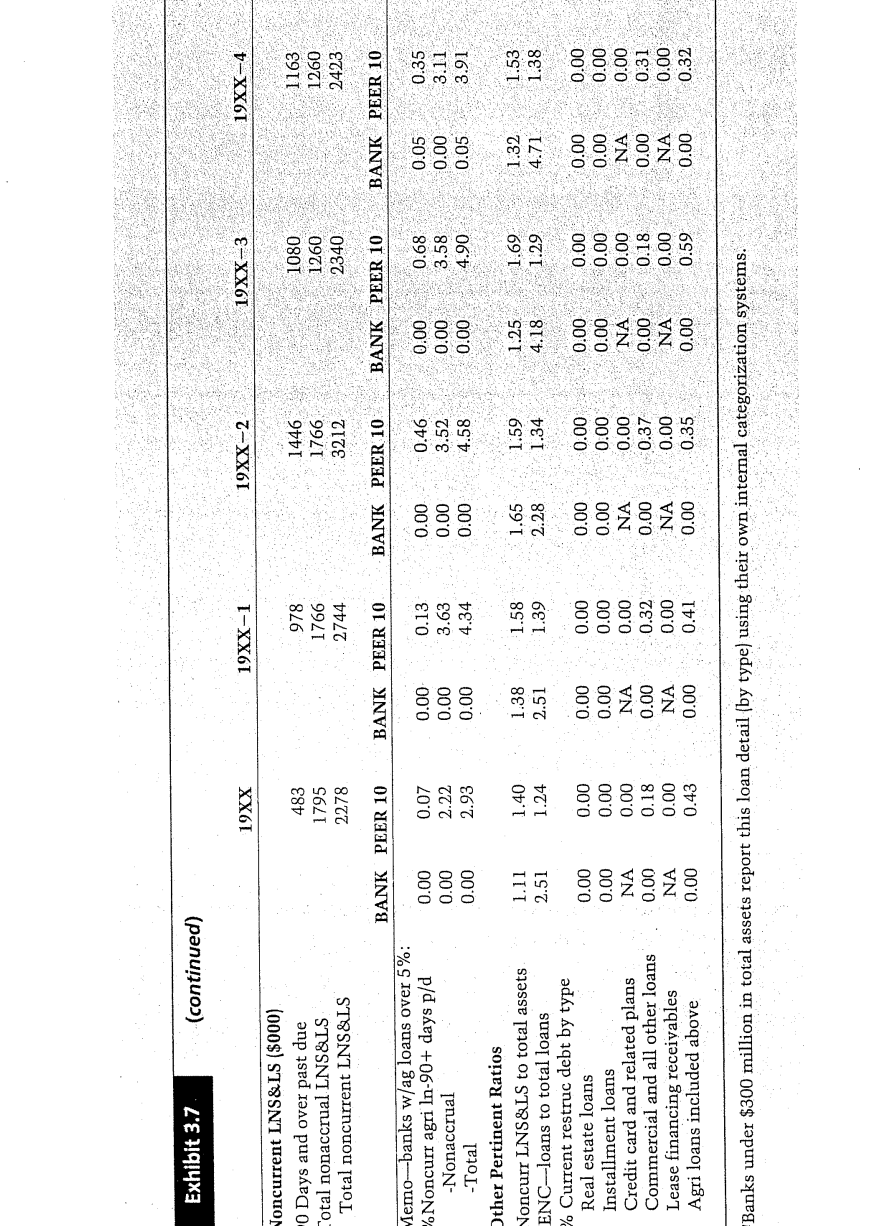
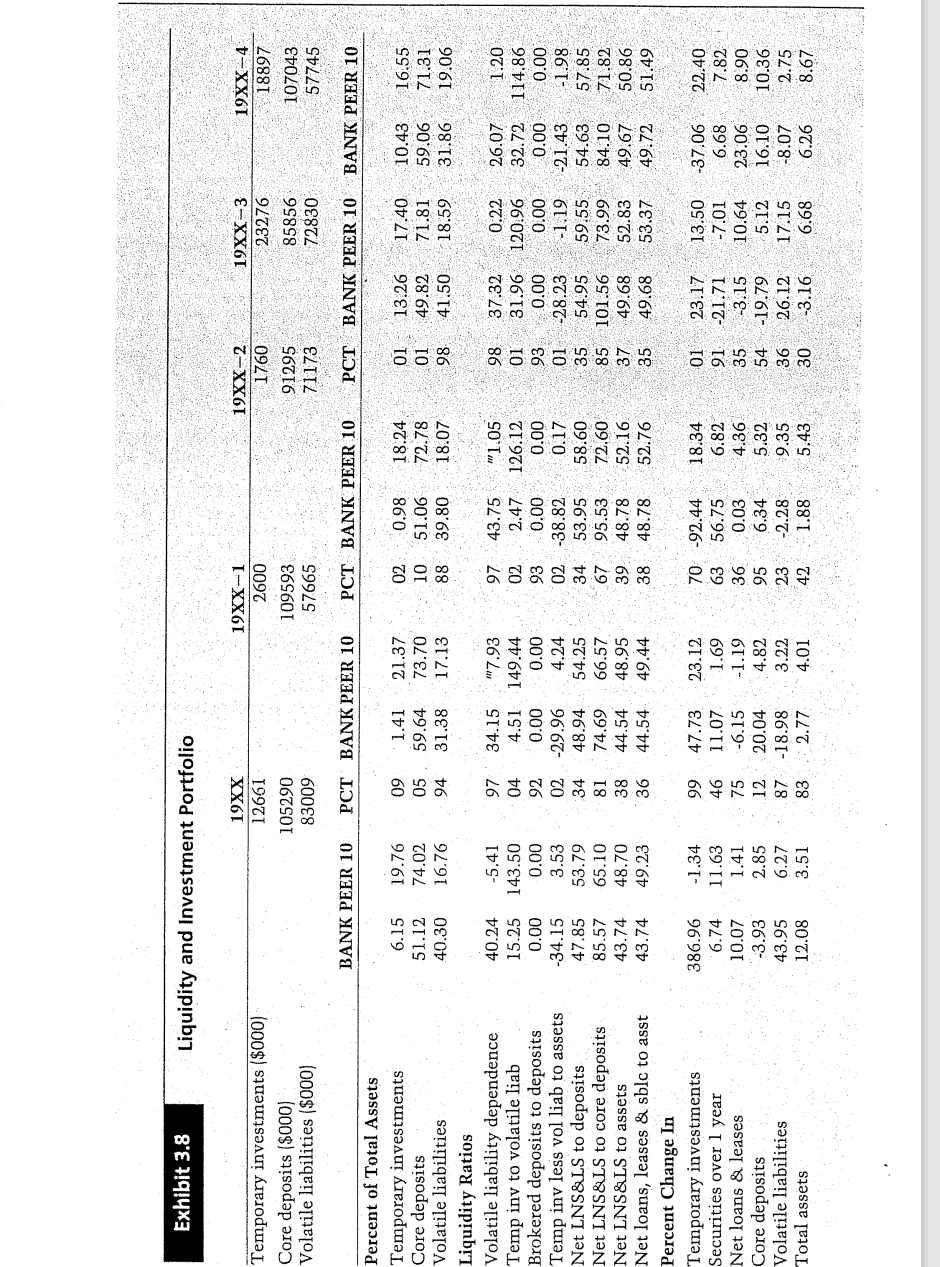
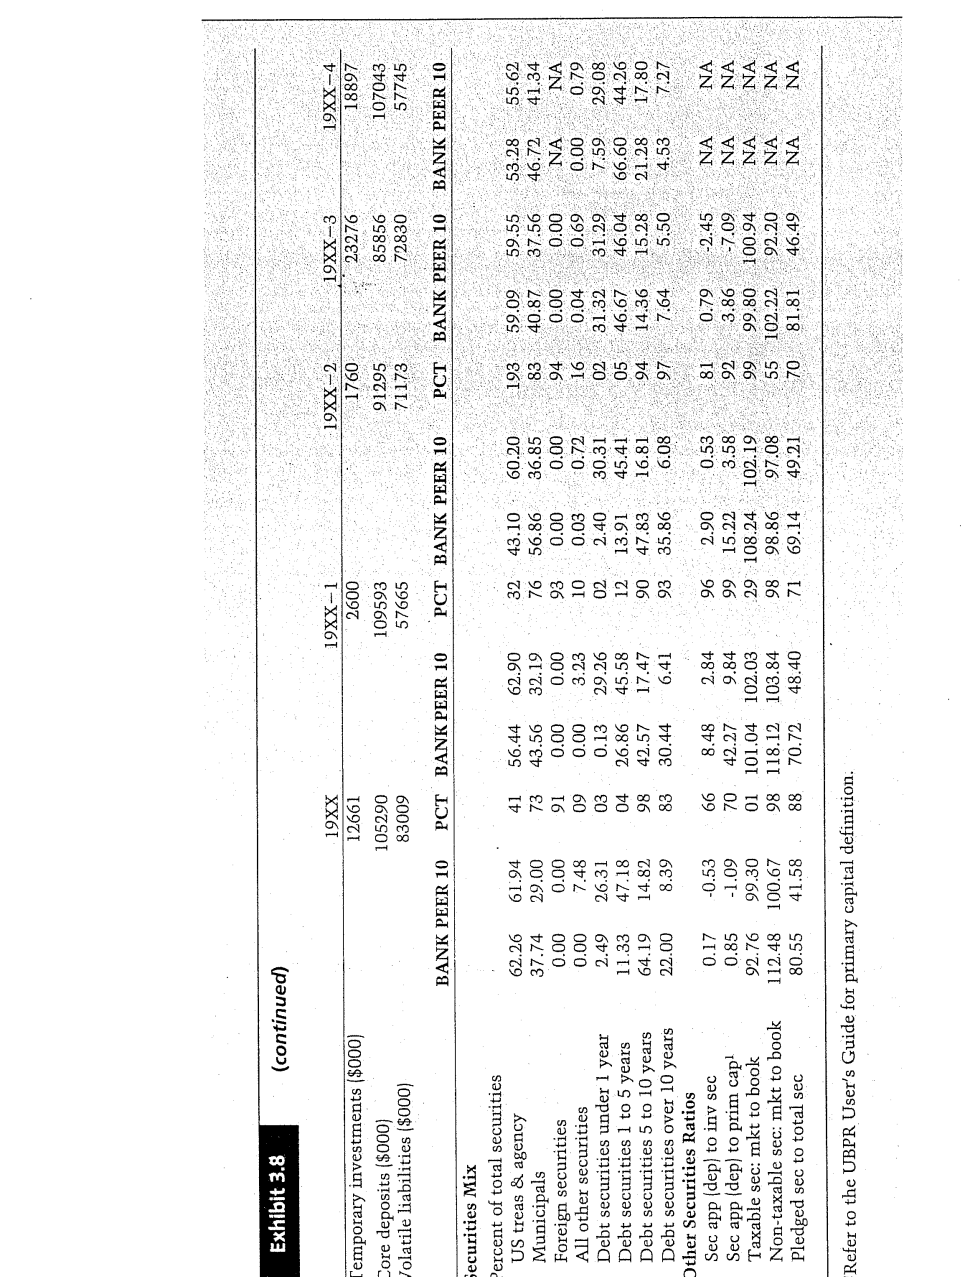
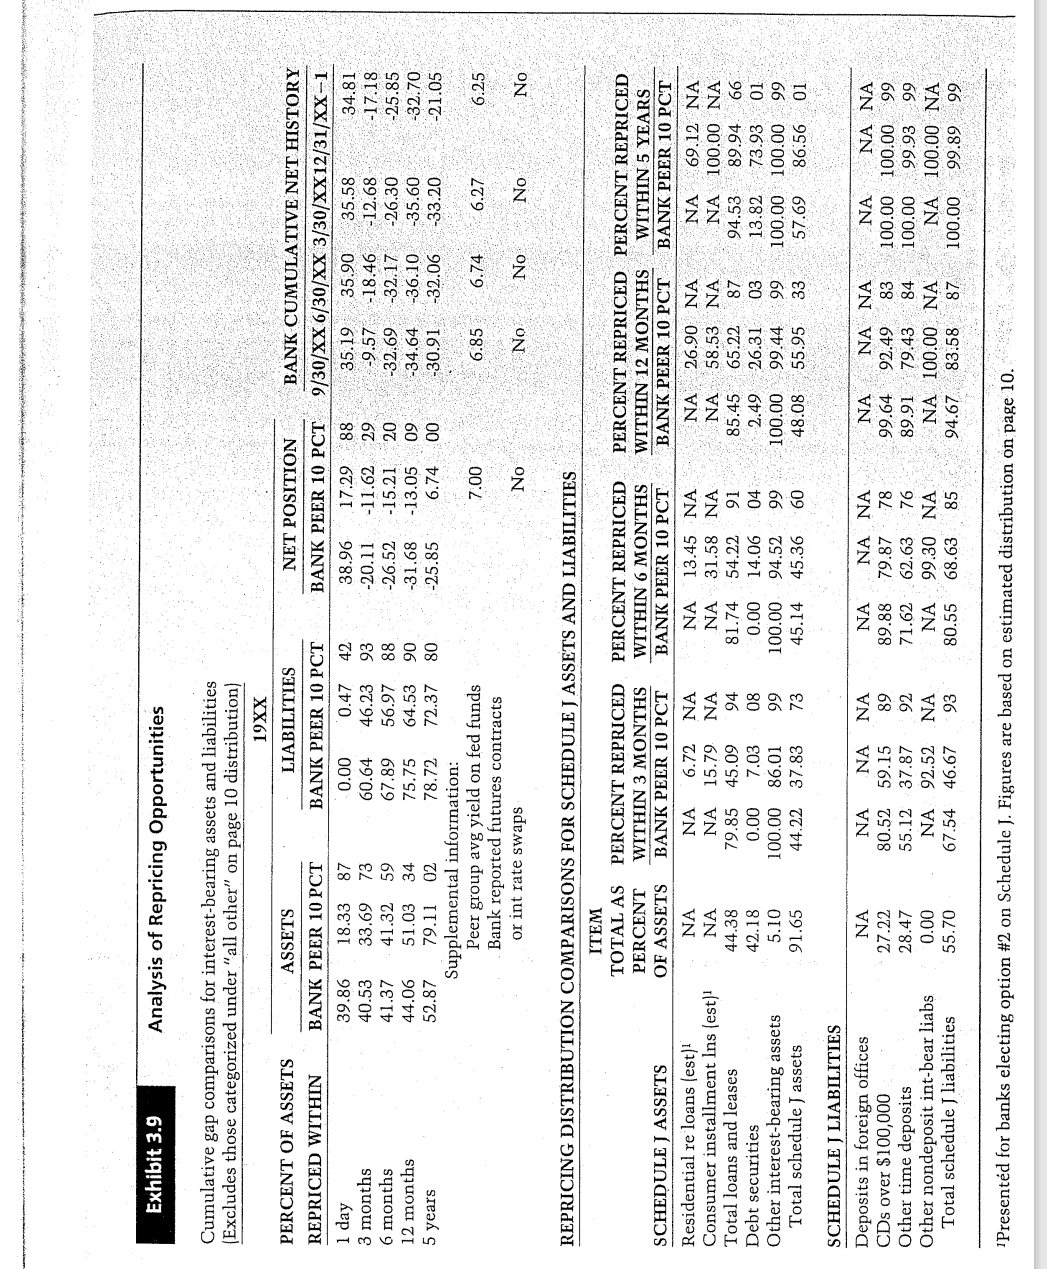
CASE STUDY HEARTLAND BANK HOLDING COMPANY Sandra Gonzales was recently hired by the vestigate in order to focus her attention on Heartland Bank Holding Company (a $1.6 the most relevant issues. billion in assets organization with 27 The initial questions she considered operating subsidiaries) as a financial were the following: analyst. While her duties involved a variety of tasks, including some auditing of 1. How profitable is Lester compared to its the subsidiaries, her first major task was to peers? How has its profitability changed analyze the possible purchase of the LNB over time? Holding Company and its sole subsidiary, 2. What are the principal differences in in- the Lester National Bank. The profile of come and expense ratios between Lester the LNB fit the policies of Heartland: a and its peers? How have they changed relatively small (about $200 million in over time? assets) bank serving a rural area, but a 3. How does Lester's credit risk compare bank that dominated its market and had with its peers? Is it higher? If so, does it been profitable throughout the years of the earn an adequate compensation for tak- recent farm crisis. Indeed, Heartland had ing credit risk? Is it adequately reserved? found its niche by acquiring smaller banks 4. How does Lester's liquidity risk com- within a radius of 250 miles located in pare with its peers? communities with relatively limited 5. Has Lester taken more or less interest competition. Hence, Sandra realized that rate risk than its peers? Has it worked? the issues here were primarily financial. 6. Does Lester have adequate capital? Is To do the analysis necessary to pre- there a significant risk that it will out- sent a report to the senior management grow its capital? (specifically the Acquisitions Committee), Sandra knew that although the an- Sandra obtained the latest Uniform Bank swers to these questions were important, Performance Report on the Lester National they were not the end of her project. As- Bank (this was essentially the same thing suming that Heartland wanted to bid for as getting the report on LNB Holding Com- LNB Inc., Sandra would be asked to value pany since the parent had no assets other the bank, that is, determine an appropriate than Lester National Bank and also did not offering price. Relevant to this issue, she have any debt on its balance sheet). While knew that the owner of LNB Inc. wanted Sandra had majored in finance during her an entirely cash transaction. She pondered days at State U, she was overwhelmed the valuation issue and in her analysis fo- with the numbers and the ratios provided cused on the attached UBPR data on Lester in the UBPR. She, therefore, decided to (Exhibits 3.4 through 3.9). write down a number of questions to in-Exhibit 3.4 Summary Ratios 19XX-1 19XX-2 19XX-3 19XX-4 19XX 176798 168902 172682 171255 Average assets ($000) 192419 2492 1687 1329 2748 Net income ($000) 2520 170 145 136 124 103 Number of banks in peer group PCT BANK PEER 10 BANK PEER 10 BANK PEER 10 PCT BANKPEER 10 PCT BANK PEER 10 Earnings and Profitability Percent of average assets: 4.41 4.15 4.28 4.43 3.31 4.34 4.05 4.54 Net interest income (TE) 4.10 3.90 0.30 0.58 0.33 0.64 0.34 0.64 0.28 0.60 0.28 0.55 + Noninterest income - Overhead expense 1.88 2.56 2.19 2.66 2.03 2.60 1.63 2.51 1.66 2.47 0.67 0.68 1.81 1.01 1.17 0.73 0.66 0.54 0.14 0.53 - Provision: loan/lease losses 1.84 1.45 0.73 1.14 1.41 1.76 1.30 1.86 2.53 2.09 = Pretax operating income (TE) 0.12 0.01 0.43 0.00 + Securities gains (losses) 0.64 0.02 1.88 0.11 0.43 0.04 = Pretax net oper inc (TE) 2.49 1.49 2.62 1.31 1.85 1.90 1.42 1.85 2.96 2:05 8899897 0.77 1.05 - 1.60 1.12 Net operating income 1.31 0.83 1.41 0.67 1.00 1.03 2.14 0.85 1.34 1.07 0.88 1.1 1 1.58 1.23 Adjusted net oper income 1.55 0.95 1.70 0.86 2.11 0.72 #1:00 0.88 1.03 1.51 1.10 Adjusted net income 1:12 1.31 0.84 1.41 0.68 1.00 1.03 0.77 1.04 1.60 Net income Percent of avg earning assets: Interest income (TE 10.01 9.56 11.44 10.49 12.28 11.72 12.56 12.55 12.00 12.21 5.38 6.48 6.03 7.43 6.92 00.00 LA 8.83 7.88 7.66 7.25 Interest expense 5.60 3.73 4.7] 4.34 4.95 Net interest income (TE) 4.41 4.20 4.96 4.48 4.85 4.83 Loan & Lease Losses, Reserves and Noncurrent Loans and Leases 1:73 1.39 1.17 0.85 0.34 0.87 Net loss to avg tot loans & Ises 0.92 1.17 2.33 1.73 1.24 3.87 2.08 4.93 2.38 9:08 7.51 9.59 Earnings coverage of net loss (x) 3.54 6.20 1.55 2.87 Loss reserve to net losses (x) 3.65 2.99 1.32 1.50 0.88 1.71 0.71 3.03 0.77 0.49 1.10 Loss resv to tot loans & leases 3.23 1.85 3.00 1.39 1.26 3.02 2.86 2.86 3.08 2:06 1.99 2.44 3.11 2.47 % Noncurrent loans & leasesExhibit 3.4 (continued) 19XX 19XX-1 19XX-2 19XX-3 19XX-4 Average assets ($000) 192419 176798 168902 #172682 171255 Net income ($000) 2520 2492 1687 1329 2748 Number of banks in peer group 170 145 136 124 103 BANK PEER 10 PCT BANKPEER 10 PCT BANK PEER 10 PCT BANK PEER 10 BANK PEER 10 Liquidity and Rate Sensitivity Volatile liability dependence 40.24 -5.41 34.15 -7.93 43.75 -1.05 37.32 0.22 26.07 1.20 43.74 48.70 52.16 49.68 52.83 Net loans & leases to assets 38 44.54 48.95 48.78 49.67 50.86 Net assets repricable in 1 year or less to assets -31.68 -13.05 09 -32.70 -10.02 04 -23.07 -5.66 08 -14.31 -7.64 -17.71 -6.97 Capitalization Prime capital to adj avg assets 8.42 8.85 8.73 8.82 8.07 8.74 7.76 8.60 7.52 8.54 Cash dividends to net income 71.43 45.75 72.23 47.30 77 106.70 45.03 0 108.35 46.83 #65.50 40.19 Ret earns to avg total equity 4.78 4.72 4.82 2.21 48 -0.83 6.06 -0.82 6.13 7.26 7.79 Growth Rates 12.08 3.51 2.77 4.01 1.88 5.43 3.16 6.68 6.26 8.67 Assets 7.46 5.98 14.18 5.28 3.37 7.27 0.96 7.71 7.25 9.21 Primary capital 10.07 1.41 -6.15 0.03 4.36 23.06 8.90 Net loans & leases -1:19 -3.15 10.64 Volatile liabilities 43.95 6.27 -18.98 3.22 -2.28 9.35 26.12 17.15 -8.07 2.75 1Refer to the UBPR User's Guide for primary capital definition.Exhibit 3.5 Balance Sheet-Percentage Composition of Assets and Liabilities 19XX 19XX-1 19XX-2 19XX-3 19XX-4 BANK PEER 10 PCT BANK PEER 10 PCT BANK PEER 10 PCT BANK PEER 10 BANK PEER 10 Assets, Percent of Avg Assets 49.98 38 51.28 50.69 53.36 47.98 51.20 Total loans 46.29 49.22 351.21 53.65 Lease financing receivables 0.00 0.00 0.00 0.00 0.00 0.00 0.00 0.01 0.00 0:00 0.66 0.59 Less: loss reserves 1.43 0.84 1.00 0.78 0.60 0.72 0.35 0.28 Transfer risk reserve NA NA NA NA NA NA NA NA NA NA NA NA NA 49.20 48.22 50.54 50.61 52.99 50.34 52.78 47.70 50.70 Net loans & leases 44.86 Securities over 1 year 43.52 22.41 41.25 20.38 96 32.22 20.30 31.04 21:57 35.09 23.25 Subtotal 88.38 71.61 89.48 70.92 98 82.83 73.29 81.38 74.35 82.79 74.45 Interest-bearing bank balances 0.21 2.30 0.11 2.15 0.00 1.92 0.44 2.41 4.77 2.87 Federal funds sold & resales 1.39 6.03 0.39 6.86 0.56 5.36 2.50 4.35 2.74 4:3 0.00 0.0 Trading account assets 0.00 0.00 0.0C 0.00 0.00 0.00 0.00 0.00 8685 9.26 2:48 7.78 Debt securities 1 yr & less 0.46 8.18 0.37 9.70 6.55 9.03 6.92 10.00 16.21 Temporary investments 2.06 20.07 0.87 20.22 7.11 . 17.54 9.86 16.63 Total earning assets 90.44 91.78 90.35 91.28 89.94 90.92 91.24 90.98 92.78 90.72 4.43 4.66 4.34 4.82 3.98 4.72 2.82 5.18 Noninterest cash & due fr banks 4.77 4.22 1.38 1.50 1.49 1.57 1.53 1.59 1.52 Premises, fix asst, cap leases 1.19 1.35 Other real estate owned 1.36 0.52 1.45 0.53 1.70 0.41 0.51 0.2 0.02 0.17 Acceptances & other assets 2.24 1.76 2.42 1.92 2.52 2.15 2.75 2.26 2.78 2.14 2 6 Subtotal 9.56 8.22 9.65 8.72 10.06 9.08 8.76 9.02 7.22 9.28 Total assets 100.00 100.00 100.00 100.00 100.00 100.00 100.00 100.00 100:01 100.00 0.01 0.01 0.52 Standby letters of credit 0.00 0.40 0.00 0.48 0.00 *0.52 0.46Exhibit 3.5 (continued) 19XX 19XX-1 19XX-2 19XX-3 19XX-4 BANK PEER 10 PCT BANK PEER 10 PCT BANK PEER 10 PCT BANK PEER 10 BANK PEER 10 Liabilities, Percent of Avg Assets Demand deposits 11.01 11.15 53 12.32 12.15 12.77 13.13 13.26 13.39 13.64 14.74 All NOW and ATS accounts 2.92 10.13 04 2.79 9.32 2.62 8.72 1.78 8.44 2.66 7.91 Super NOWS included in above NA NA NA NA NA NA 0.39 3.98 0.22 3.51 0.17 2.21 MMDA savings 21.18 12.77 21.29 13.50 16.90 11.87 15.65 10.83 6.96 8.19 Other savings deposits 1.54 6.07 1.78 4.94 2.01 4.74 2.17 5.23 4.16 7:24 Time deposits under $100M 15.30 32.23 15.51 32.94 06 15.54 33.55 19.66 33.66 27.44 32.68 Core deposits 51.97 73.73 53.68 73.13 72.29 52.53 71.70 54.86 71.55 885 49.85 Time deposits over $100M 39.04 14.70 36.56 15.17 40.61 15.55 37.70 15.67 34.69 15.64 Deposits in foreign offices NA NA NA NA NA NA NA NA NA NA NA Federal funds purchrepos 0.16 0.93 0.20 1:06 0.09 1.17 0.64 1.48 1.49 2.35 Other borrowing ( + note opt) 0.00 0.27 0.34 0.31 0.00 :0.31 0.00 0.33 0.00 0.26 Volatile liabilities 39.21 16.90 37.10 17.42 40.71 17.97 38.34 18.56 36.18 18.73 Acceptances & other liab 1.07 1.03 1.19 1.19 1.53 1.39 1.37 1.44 1.38 1.45 Total liabilities (incl mortg 92.25 91.92 91.97 :91.97 43 92.09 91.92 92.24 91.86 92.42 91.93 Subordinated notes & debentures 0.00 0.00 0.00 . 0.00 0.00 0.00 0.00 0.00 0.00 0.00 All common & preferred capital 7.75 8.04 8.03 7.95 7.91 8.01 7.06 7.92 7.58 7.91 Total liabilities & capital 100.00 100.00 100:00 100.00 100.00 100.00 100.00 100.00 100.00 100.00 Noninterest bearing deposits 11.01 11.16 13.41 12.30 14.86 13.29 :14.23 13.56 13.64 14.74 Interest bearing deposits 80.00 77.55 76.84 76.30 75.61 75.01 76.01 74.17 75.92 72.42 Total brokered deposits 0.00 0.00 0.00 0.00 :0.00 0.00 #0.00 0.00 0.00 0.00Exhibit 3.6 Analysis of Allowance for Loan and Lease Losses and Loan Mix 19XX 19XX-1 19XX-2 19XX-3 19XX-4 Change: Loans & Lease Reserve ($000) 2536 679 439 483 Beginning balance 1247 Gross loan & lease losses 1129 2084 1444 1054 337 305 165 33 102 284 Recoveries 824 1919 1411 952 284 Net loan & lease losses 1294 3208 1980 1142 241 Provision for loan, lease loss Other adjustments 440 Ending balance 3006 2536 1248 NA NA NA Z Net ATTR charge-offs NA NA NA NA NA Other ATTR changes (net) NA 83433 81478 81568 83275 Average total LNS&LS 89737 BANK PEER 10 PCT BANK PEER 10 PCT BANK PEER 10 PCT BANK PEER 10 BANK PEER 10 Analysis Ratios 0.54 0.14 0.53 Loss provision to avg assets 0.67 0.68 1.81 1.01 82 .1.17 0.73 0.66 82 2.43 1.43 1.40 0.96 0.29 0.98 Loss prov to avg total LNS&LS 1.44 1.32 3.89 1.91 Net losses to avg tot LNS&LS 0.92 1.17 2.33 1.73 74 1.73 1.39 1.17 0.85 0.34 0.87 1.02 0.40 1.03 Gross loss to avg tot LNS&LS 1.26 1.36 2.53 1.96 1.77 1.58 1.29 0.13 0.16 0.06 0.13 Recoveries to avg tot LNS&LS 0.34 0.24 0.20 0.22 0.04 0.16 23.74 30.27 23.29 12.59 24.29 Recoveries to prior period loss 14.64 17.91 11.43 20.61 3.13 1.85 3.00 1.67 1.41 1.39 0.77 1.26 0.49 1.10 Loss reserve to tot LNS&LS 3.23 Loss reserve to net losses (x) 3.65 2.99 1.32 1.50 0.88 1.71 0.71 3.03 1.55 2.87 Loss resv to nonaccrual LNS&LS (x) 1.67 1.46 2.01 1.06 0.96 1.02 0.31 1.47 0.33 2.12 6.20 1:24 3.87 2.08 1.93 2.38 9.08 7.51 9.59 Earn coverage of net losses (x) 3.54hibit 3.6 (continued) 19XX -1 19XX-2 19XX-3 19XX-4 19XX Mix, % Avg Gross LNS&LS 0.47 1.80 0.39 2.46 28 0.41 2.64 0.44 2.74 2.08 2.88 ruction & development 15.16 19.21 45 11.74 17.75 10.06 16.75 9.49 16.59 mily residential 19.08 22.02 32.01 18.27 26.97 17.04 85 24.51 15.35 23.50 13.81 23.29 13.12 real estate loans 33.99 33.96 34.85 33.25 al real estate 51.56 . 42.83 42.52 39.23 36.67 36.46 0:00 0.00 0.09 0.10 0.37 0.43 cial institution loans 0.00 0.00 0.00 0.00 altural loans 21.43 7.11 88 22.42. 7.9 88 25.14 8.36 24.88 9.58 23.61 10.00 29.71 21.05 31.88 ercial & industrial loans 11.17 23.41 14.29 26.52 13 15.68 28.37 20.05 11.51 16.18 19.19 17.43 19.45 15.89 19.30 18.18 15.35 19.21 to individuals 1.00 1.70 1:09 1.40 0.29 NA NA cipal loans 1.17 1.51 0.00 0.24 NA NA tances of other banks 0.00 0.00 0.00 0.00 0.00 0.07 0.00 0.00 0.00 0.00 0.00 0.00 0.00 0.00 0:00 0.00 leases in foreign offices 0.99 3.60 1.34 4.00 1.59 5.34 1.59 4.22 1.67 her loans 3.16 0.00 0.00 0.00 0.00 0.00 0.02 0.00 financing receivables 0.00 0.00 0.00 randum (% of avg tot loans) 0.00 nmercial paper in loans 0.00 0.00 0.00 0.00 0.00 0.00 0.00 0.00 0.00 0.31 0.36 0.21 0.37 0.47 0.40 0.38 0.31 1.54 0.59 icer, shareholder loans 14.75 5.05 16.87 4.56 15.42 4.35 13.13 3.62 n & lease commitments 17.51 5.57 0.17 0.00 0.27 1.20 0.59 1.62 0.87 ns sold during the quarter 0.00 0.15 0.00 osition changes: 6.59 14.10 14.67 16.01 14.37 8.82 18.41 8.48 et mix 9.00 15.78 14.54 15.08 14.72 n mix (including leases) 16.24 11.64 11.70 13.37 12.44 12.90 76.95 ty mix 19.14 12.72 26.30 24.10 12.29 57.20 84.09 53.11Exhibit 3.7 Analysis of Past Due, Nonaccrual, and Restructured Loans and Leases 19XX-1 19XX-2 19XX-3 19XX-4 19XX Noncurrent LNS&LS ($000) 1080 483 978 1446 1163 20 Days and over past due 1766 1766 1260 1260 otal nonaccrual LNS&LS 1795 2744 3212 2340 2423 Total noncurrent LNS&LS 2278 BANK PEER 10 BANK PEER 10 BANK PEER 10 BANK PEER 10 BANK PEER 10 Noncurr as % of Avg LNS&LSI 0.65 1.87 0.82 2.72 0.81 2.31 0.66 2.55 0.82 Real estate Ins-90+ days p/d 0.36 4.04 2.42 3.75 2.24 2.95 2.40 3.26 2.17 -Nonaccrual 3.51 2.34 6.47 3.21 5.26 3.27 5.82 3.12 3.87 5.91 3.36 -Total 3.07 0.30 0:83 0.65 0.49 0.16 0.66 0.37 0.69 0.18 0.83 Coml, other Ins-90+ days p/d 2.93 0.00 3.04 0.00 2.93 -Nonaccrual 0.07 2.68 0.00 2.90 0.00 3.57 0.37 3.93 0.18 4.06 0.30 3.80 -Total 0.72 3.27 0.16 0.77 0.65 1.25 0.66 nstallment Ins-90+ days p/d 2.43 0.79 4.34 0.78 1.02 0.72 0.00 0.23 0.00 0.18 0.00 0.21 0.00 0.21 -Nonaccrual 0.00 0.19 1.25 0.93 2.43 1.09 4.34 1.18 1.02 1.03 0.77 0.97 -Total NA 0.24 Credit card plans-90+ days p/d NA 0.36 NA 0.40 NA 0.27 NA 0.35 0.00 2.90 0.00 2.93 0.00 3.04 0.00 2.93 -Nonaccrual 0.07 2.68 0.27 NA 0.39 NA 0.26 Total NA 0.37 NA 0:37 NA NA NA 0.00 NA 0.00 Cease financing-90+ days p/d NA 0.00 NA 0.00 0.00 0.00 NA 0.00 NA 0.00 NA 0.00 NA 0.00 NA -Nonaccrual NA 0.00 NA 0.00 NA 0.00 NA 0.00 NA 0.00 -Total 1.37 0.83 0.52 0.60 1.03 0.78 1.62 0.87 1.23 0.82 Total LNS&LS-90+ days p/d 1.97 2.37 1.43 2.61 1.49 2.24 1.93 2.45 1.86 2.37 -Nonaccrual 3.22 3.50 2.86 3.1 1 2.89 2.66 -Total 2.44 3.02 3.08 3.59Exhibit 3.7 (continued) 19XX 19XX-1 19XX-2 19XX-3 19XX-4 oncurrent LNS&LS ($000) 0 Days and over past due 483 978 1446 1080 1163 otal nonaccrual LNS&LS 1795 1766 1766 1260 1260 Total noncurrent LNS&LS 2278 2744 3212 2340 2423 BANK PEER 10 BANK PEER 10 BANK PEER 10 BANK PEER 10 BANK PEER 10 lemo-banks w/ag loans over 5%: 6 Noncurr agri In-90+ days p/d 0.00 0.07 0.00 0.13 0.00 0.46 0.00 0.68 0.05 0.35 -Nonaccrual 0.00 2.22 0.00 3.63 0.00 3.52 0.00 3.58 0.00 3.11 -Tota 0.00 2.93 0.00 4.34 0.00 4.58 0.00 4.90 0.05 3.91 Other Pertinent Ratios Joncurr LNS&LS to total assets 1.11 1.40 1.38 1.58 1.65 1:59 1.25 1.69 1.32 1.53 ENC-loans to total loans 2.51 1.24 2.51 1.39 2.28 1.34 4.18 1.29 4.71 1.38 Current restrucaebt by type Real estate loans 0.00 0.00 0.00 0.00 0.00 0.00 0.00 0.00 0.00 0.00 Installment loans 0.00 0.00 0.00 0.00 0.00 0.00 0.00 0.00 0.00 0.00 Credit card and related plans NA 0.00 NA 0.00 NA 0.00 NA 0.00 NA 0.00 Commercial and all other loans 0.00 0.18 0.00 0.32 0.00 0.37 0.00 0.18 0.00 0.31 Lease financing receivables NA 0.00 NA 0.00 NA 0.00 NA 0.00 NA 0.00 Agri loans included above 0.00 0.43 0.00 0.41 0.00 0.35 0.00 0.59 0.00 0.32 Banks under $300 million in total assets report this loan detail (by type) using their own internal categorization systems.Exhibit 3.8 Liquidity and Investment Portfolio 19XX 19XX-1 19XX-2 19XX-3 19XX-4 Temporary investments ($000) 12661 2600 1760 23276 18897 Core deposits ($000) 105290 109593 91295 85856 107043 Volatile liabilities ($000) 83009 57665 71173 72830 57745 BANK PEER 10 PCT BANK PEER 10 PCT BANK PEER 10 PCT BANK PEER 10 BANK PEER 10 Percent of Total Assets Temporary investments 6.15 19.76 1.41 21.37 0.98 18.24 13.26 17.40 10.43 16.55 Core deposits 51.12 74.02 59.64 73.70 51.06 72.78 49.82 71.81 59.06 71.3] Volatile liabilities 40.30 16.76 94 31.38 17.13 88 39.80 18.07 41.50 18.59 31.86 19.06 Liquidity Ratios Volatile liability dependence 40.24 -5.41 97 34.15 "7.93 43.75 "1.05 37.32 0.22 26.07 1.20 Temp inv to volatile liab 15.25 143.50 4.51 149.44 2.47 126.12 31.96 120.96 32.72 114.86 Brokered deposits to deposits 0.00 0.00 0.00 0.00 0.00 0.00 0.00 0.00 0.00 0.00 Temp inv less vol liab to assets -34.15 3.53 -29.96 4.24 -38.82 0.17 -28.23 -1.19 -21.43 -1.98 68283588 Net LNS&LS to deposits 47.85 53.79 34 48.94 54.25 53.95 58.60 54.95 59.55 54.63 57.85 Net LNS&LS to core deposits 85.57 65.10 74.69 66.57 95.53 72.60 101.56 73.99 84.10 71.82 Net LNS&LS to assets 43.74 48.70 44.54 48.95 48.78 52.16 49.68 52.83 49.67 50.86 Net loans, leases & sblc to asst 43.74 49.23 36 44.54 49.44 48.78 52.76 49.68 53.37 49.72 51.49 Percent Change In Temporary investments 386.96 -1.34 47.73 23.12 -92.44 18.34 23.17 13.50 -37.06 22.40 Securities over 1 year 6.74 11.63 11.07: 1.69 56.75 6.82 21.71 -7.01 6.68 7.82 Net loans & leases 10.07 1.41 -6.15 -1.19 0.03 4.36 -3.15 10.64 23.06 8.90 Core deposits -3.93 2.85 20.04 4.82 6.34 5.32 -19.79 5.12 16.10 10.36 Volatile liabilities 43.95 6.27 -18.98 3.22 -2.28 9.35 26.12 17.15 -8.07 2.75 8:67 Total assets 12.08 3.51 2.77 4.01 1.88 5.43 -3.16 6.68 6.26Exhibit 3.8 (continued) 19XX 19XX-1 19XX-2 19XX-3 19XX-4 emporary investments ($000) 12661 2600 1760 23276 18897 Core deposits ($000) 105290 109593 91295 85856 107043 Volatile liabilities ($000) 83009 57665 71173 72830 57745 BANK PEER 10 PCT BANKPEER 10 PCT BANK PEER 10 PCT BANK PEER 10 BANK PEER 10 securities Mix ercent of total securities US treas & agency 62.26 61.94 56.44 62.90 43.10 60.20 193 59.09 59.55 53.28 55.62 37.74 29.00 43.56 32.19 56.86 36.85 40.87 37.56 46.72 41.34 Municipals Foreign securities 0.00 0.00 0.00 0.00 93 0.00 0.00 0.00 0.00 NA NA 0.00 7.48 0.00 3.23 2 0.03 0.72 0.04 0.69 0.00 All other securities 0.79 Debt securities under 1 year 2.49 26.31 0.13 29.26 2.40 30.31 31.32 31.29 7.59 29.08 Debt securities 1 to 5 years 11.33 47.18 04 26.86 45.58 12 13.91 45.41 46.67 46.04 66.60 44.26 Debt securities 5 to 10 years 64.19 14.82 42.57 17.47 90 47.83 16.81 14.36 15.28 21.28 17.80 Debt securities over 10 years 22.00 8.39 30.44 6.41 93 35.86 6.08 7.64 5.50 4.53 7.27 Other Securities Ratios Sec app (dep) to inv sec 0.17 -0.53 8.48 2.84 96 2.90 0.53 0.79 -2.45 NA NA Sec app ( dep) to prim cap! 0.85 -1.09 42.27 9.84 15.22 3.58 3.86 -7.09 NA NA Taxable sec: mkt to book 92.76 99.30 01 101.04 102.03 29 108.24 102.19 99.80 100.94 NA NA Non-taxable sec: mkt to book 112.48 100.67 98 118.12 103.84 98 98.86 97.08 5 102.22 92.20 NA NA 88 70.72 48.40 F Pledged sec to total sec 80.55 41.58 69.14 49.21 81,81 46.49 NA NA Refer to the UBPR User's Guide for primary capital definition.Exhibit 3.9 Analysis of Repricing Opportunities Cumulative gap comparisons for interest-bearing assets and liabilities (Excludes those categorized under "all other" on page 10 distribution) 19XX PERCENT OF ASSETS ASSETS LIABILITIES NET POSITION BANK CUMULATIVE NET HISTORY REPRICED WITHIN BANK PEER 10 PCT BANK PEER 10 PCT BANK PEER 10 PCT 9/30/XX 6/30/XX 3/30/XX12/31/XX-1 1 day 39.86 18.33 87 0.00 0.47 42 38.96 17.29 #88 35.19 35.90 35.58 34.81 3 months 40.53 33.69 73 60.64 46.23 93 -20.11 :-11.62 29 -9.57 -18.46 -12.68 -17.18 6 months 41.37 41.32 59 67.89 56.97 88 -26.52 -15.21 20 -32.69 -32.17 -26.30 -25.85 12 months 44.06 51.03 34 75.75 64.53 90 -31.68 -13.05 09 -34.64 -36.10 -35.60 -32.70 5 years 52.87 79.11 02 78.72 72.37 80 -25.85 6.74 100 -30.91 -32.06 -33.20 -21.05 Supplemental information: Peer group avg yield on fed funds 7.00 6.85 6.74 6.27 6.25 Bank reported futures contracts No No No No 2 or int rate swaps REPRICING DISTRIBUTION COMPARISONS FOR SCHEDULE J ASSETS AND LIABILITIES ITEM TOTAL AS PERCENT REPRICED PERCENT REPRICED PERCENT REPRICED PERCENT REPRICED PERCENT WITHIN 3 MONTHS WITHIN 6 MONTHS WITHIN 12 MONTHS WITHIN 5 YEARS SCHEDULE J ASSETS OF ASSETS BANK PEER 10 PCT BANK PEER 10 PCT BANK PEER 10 PCT BANK PEER 10 PCT Residential re loans (est) NA NA 6.72 NA NA 13.45 NA NA 26.90 NA NA 69.12 NA Consumer installment Ins (est)' NA NA 15.79 NA NA 31.58 NA NA 58.53 NA NA 100.00 NA Total loans and leases 44.38 79.85 45.09 94 81.74 54.22 91 85.45 65.22 94.53 89.94 66 Debt securities 42.18 0.00 7.03 08 0.00 14.06 04 2.49 26.31 13.82 73.93 01 Other interest-bearing assets 5.10 100.00 86.01 100.00 94.52 100.00 99.44 #99 100.00 100.00 99 Total schedule J assets 91.65 44.22 45.14 45.36 48.08 55.95 57.69 86.56 0 SCHEDULE J LIABILITIES Deposits in foreign offices NA NA NA NA NA NA NA NA NA NA NA NA NA CDs over $100,000 27.22 80.52 59.15 89 89.88 79.87 :78 99.64 92.49 83 100.00 100.00 99 Other time deposits 28.47 55.12 92 71.62 62.63 76 89.91 79.43 :99 Other nondeposit int-bear liabs 0.00 92.52 NA NA 99.30 NA NA 100.00 NA NA 100.00 NA Total schedule J liabilities 55.70 67.54 46.67 93 80.55 68.63 85 94.67 83.58 87 100.00 99.89 "Presented for banks electing option #2 on Schedule J. Figures are based on estimated distribution on page 10
Step by Step Solution
There are 3 Steps involved in it
Step: 1
Get Instant Access to Expert-Tailored Solutions
See step-by-step solutions with expert insights and AI powered tools for academic success
Step: 2
Step: 3
Ace Your Homework with AI
Get the answers you need in no time with our AI-driven, step-by-step assistance