Question
R language Exercise 1.2: Creating a histogram of values drawn from a Normal distribution (a) Use the following commands to generate 25 z-values and

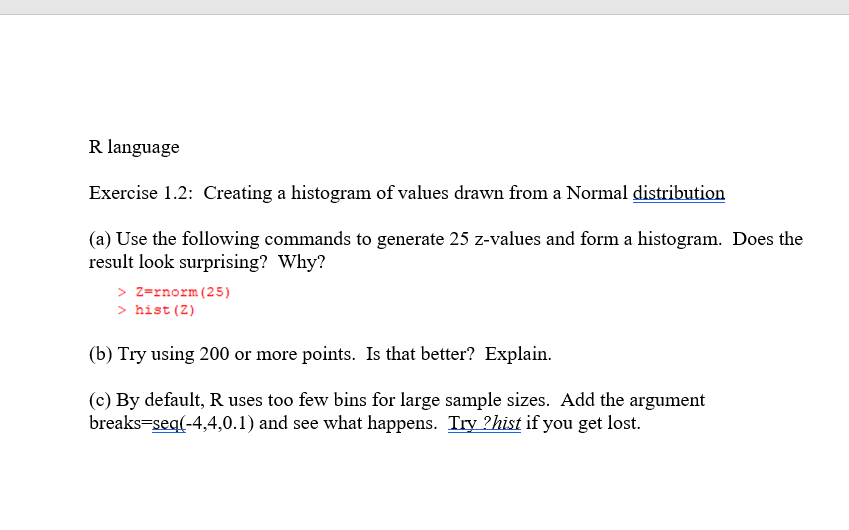
R language Exercise 1.2: Creating a histogram of values drawn from a Normal distribution (a) Use the following commands to generate 25 z-values and form a histogram. Does the result look surprising? Why? > Z=rnorm (25) > hist (2) (b) Try using 200 or more points. Is that better? Explain. (c) By default, R uses too few bins for large sample sizes. Add the argument breaks-seq(-4,4,0.1) and see what happens. Try ?hist if you get lost.
Step by Step Solution
3.41 Rating (151 Votes )
There are 3 Steps involved in it
Step: 1
a The result of the command histZ will create a histogram of the 25 zvalues generated from a Norma...
Get Instant Access to Expert-Tailored Solutions
See step-by-step solutions with expert insights and AI powered tools for academic success
Step: 2

Step: 3

Ace Your Homework with AI
Get the answers you need in no time with our AI-driven, step-by-step assistance
Get StartedRecommended Textbook for
Linear Algebra with Applications
Authors: Steven J. Leon
7th edition
131857851, 978-0131857858
Students also viewed these Programming questions
Question
Answered: 1 week ago
Question
Answered: 1 week ago
Question
Answered: 1 week ago
Question
Answered: 1 week ago
Question
Answered: 1 week ago
Question
Answered: 1 week ago
Question
Answered: 1 week ago
Question
Answered: 1 week ago
Question
Answered: 1 week ago
Question
Answered: 1 week ago
Question
Answered: 1 week ago
Question
Answered: 1 week ago
Question
Answered: 1 week ago
Question
Answered: 1 week ago
Question
Answered: 1 week ago
Question
Answered: 1 week ago
Question
Answered: 1 week ago
Question
Answered: 1 week ago
Question
Answered: 1 week ago
Question
Answered: 1 week ago
Question
Answered: 1 week ago
Question
Answered: 1 week ago
View Answer in SolutionInn App


