MR Metode
Answer the following questions with step by step explanaion
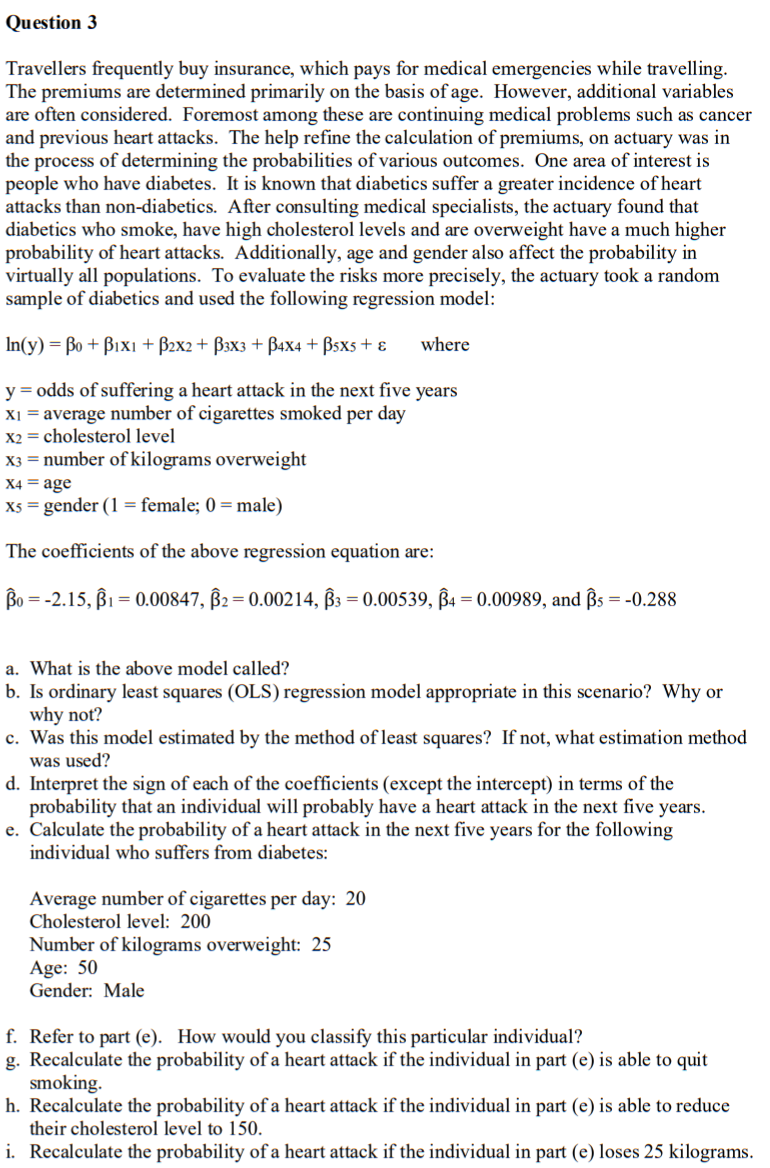
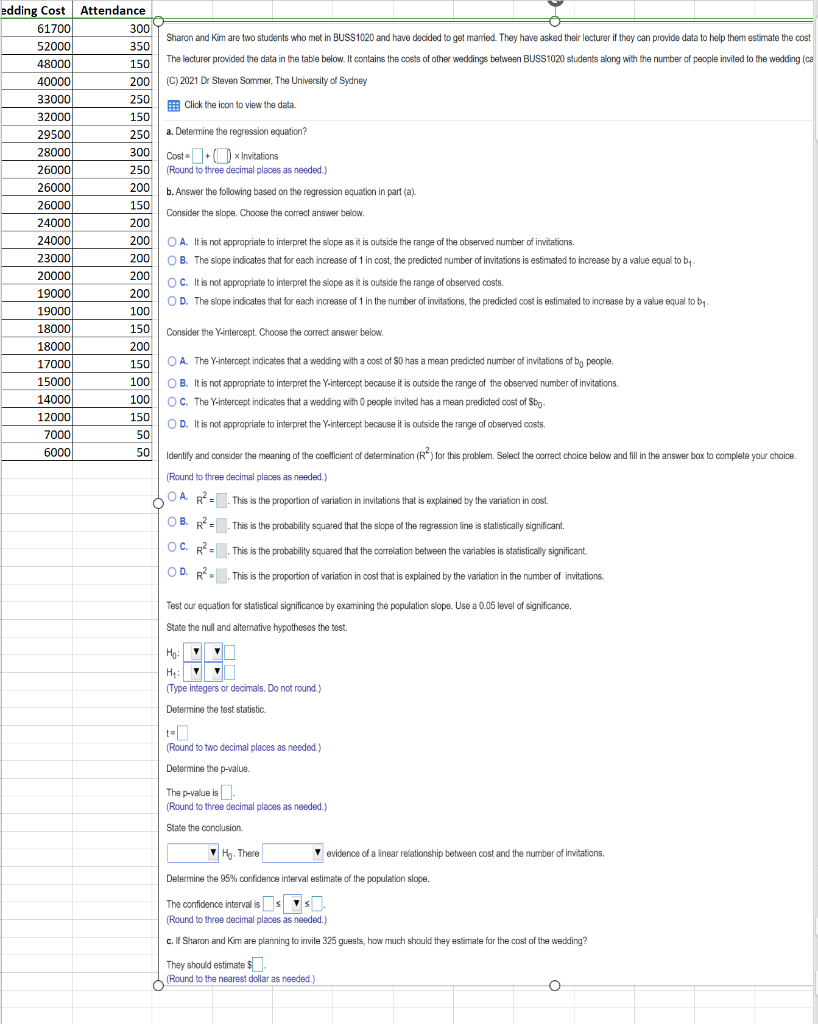
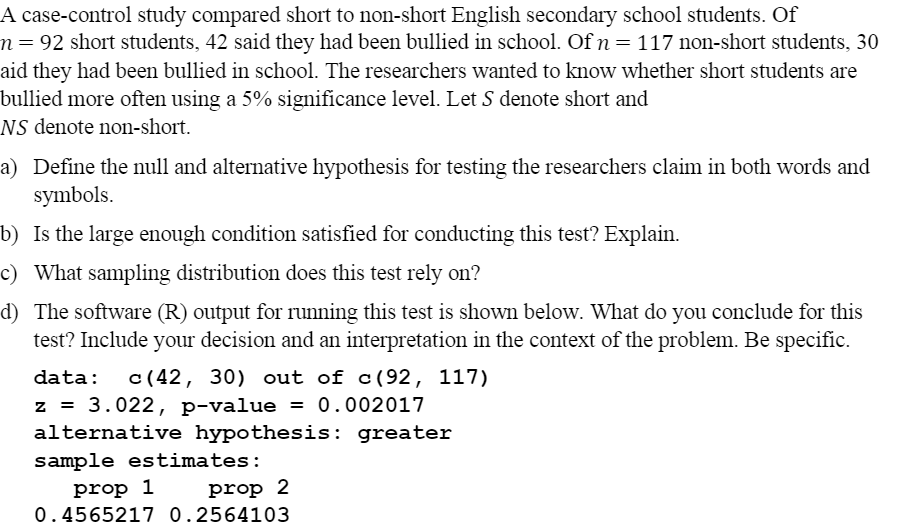
Question 3 Travellers frequently buy insurance, which pays for medical emergencies while travelling. The premiums are determined primarin on the basis of age. However, additional variables are often considered. Foremost among these are continuing medical problems such as cancer and previous heart attacks. The help rene the calculation of premiums, on actuary was in the process of determining the probabilities of various outcomes. One area of interest is people who have diabetes. It is known that diabetics suffer a greater incidence of heart attacks than non-diabetics. After consulting medical specialists, the actuary found that diabetics who smoke, have high cholesterol levels and are overweight have a much higher probability of heart attacks. Additionally, age and gender also affect the probability in virtually all populations. To evaluate the risks more precisely, the actuary took a random sample of diabetics and used the following regression model: ln(y)=o+lxi +2x2+m+4x4+sxs+s where y = odds of suffering a heart attack in the next ve years in = average number of cigarettes smoked per day x2 = cholesterol level x3 = number of kilograms overweight x4 = age X5 = gender (1 = female; 0 = male) The coefcients of the above regression equation are: Bo = 4.113: = 000341 B: = 0.00214, 33 = 0.00539, 34 = 0.00939, and B; = -0.233 a. What is the above model called? b. Is ordinary least squares (0L5) regression model appropriate in this scenario? Why or why not? c. Was this model estimated by the method of least squares? If not, what estimation method was used? d. Interpret the sign of each of the coefcients (except the intercept) in terms of the probability that an individual will probably have a heart attack in the next five years. c. Calculate the probability of a heart attack in the next ve years for the following individual who suffers om diabetes: Average number of cigarettes per day: 20 Cholesterol level: 200 Number of kilograms overweight: 25 Age: 50 Gender. Male f. Refer to part (c). How would you classify this particular individual? g. Recalculate the probability of a heart attack if the individual in part {c} is able to quit smoking. h. Recalculate the probability of a heart attack if the individual in part {c} is able to reduce their cholesterol level to 150. i. Recalculate the probability of a heart attack if the individual in part (c) loses 25 kilograms. edding Cost | Attendance 61700 300 52000 Sharon and Kim are two students who met in BUSS 1020 and have decided to get married. They have asked their lecturer if they can provide data to help them estimate the cost 350 18000 150 The lecturer provided the data in the table below. It contains the costs of other weddings between BUSS1020 students along with the number of people invited to the wedding (ca 10000 200 (C) 2021 Dr Steven Sommer, The University of Sydney 33000 250 Click the icon to view the data. 32000 150 29500 250 a. Determine the regression equation? 28000 300 Cost =+ () * Invitations 26000 250 (Round to three decimal places as needed.) 26000 200 b. Answer the following based on the regression equation in part (a). 26000 150 Consider the slope. Choose the correct answer below. 24000 200 24000 200 O A. It is not appropriate to interpret the slope as it is outside the range of the observed number of invitations, 23000 200 O B. The slope indicates that for each increase of 1 in cost, the predicted number of invitations is estimated to increase by a value equal to by . 20000 200 O C. It is not appropriate to interpret the slope as it is outside the range of observed costs. 19000 200 O D. The slope indicates that for each increase of 1 in the number of invitations, the predicted cost is estimated to increase by a value equal to by- 19000 100 18000 150 Consider the Y-intercept. Choose the correct answer below. 18000 200 17000 150 O A. The Y-intercept indicates that a wedding with a cost of $0 has a mean predicted number of invitations of by people. 15000 100 O B. It is not appropriate to interpret the Y-intercept because it is outside the range of the observed number of invitations. 14000 100 O C. The Y-intercept indicates that a wedding with 0 people invited has a mean predicted cost of Shop- 12000 150 O D. It is not appropriate to interpret the Y-intercept because it is outside the range of observed costs. 7000 50 6000 50 Identify and consider the meaning of the coefficient of determination (R") for this problem. Select the correct choice below and fill in the answer box to complete your choice. Round to three decimal places as needed.) O A R" =. This is the proportion of variation in invitations that is explained by the variation in cost. O B. R? = . This is the probability squared that the slope of the regression line is statistically significant. O C. R? =. This is the probability squared that the correlation between the variables is statistically significant. O D. R? = . This is the proportion of variation in cost that is explained by the variation in the number of invitations. Test our equation for statistical significance by examining the population slope. Use a 0.05 level of significance. State the null and alternative hypotheses the test. (Type integers or decimals. Do not round.) Determine the test statistic t= (Round to two decimal places as needed.) Determine the p-value. The p-value is. (Round to three decimal places as needed.) State the conclusion. Ho. There evidence of a linear relationship between cost and the number of invitations, Determine the 95% confidence interval estimate of the population slope. The confidence interval is s s. (Round to three decimal places as needed.) c. If Sharon and Kim are planning to invite 325 guests, how much should they estimate for the cost of the wedding? They should estimate $ (Round to the nearest dollar as needed.) OA case-control study compared short to non-short English secondary school students. Of n = 92 short students, 42 said they had been bullied in school. Of n = 117 non-short students, 30 aid they had been bullied in school. The researchers wanted to know whether short students are bullied more often using a 5% significance level. Let S denote short and NS denote non-short. a) Define the null and alternative hypothesis for testing the researchers claim in both words and symbols. b) Is the large enough condition satisfied for conducting this test? Explain. c) What sampling distribution does this test rely on? d) The software (R) output for running this test is shown below. What do you conclude for this test? Include your decision and an interpretation in the context of the problem. Be specific. data: c(42, 30) out of c (92, 117) z = 3. 022, p-value = 0. 002017 alternative hypothesis: greater sample estimates: prop 1 prop 2 0 . 4565217 0. 2564103


