Answered step by step
Verified Expert Solution
Link Copied!

Question

1 Approved Answer

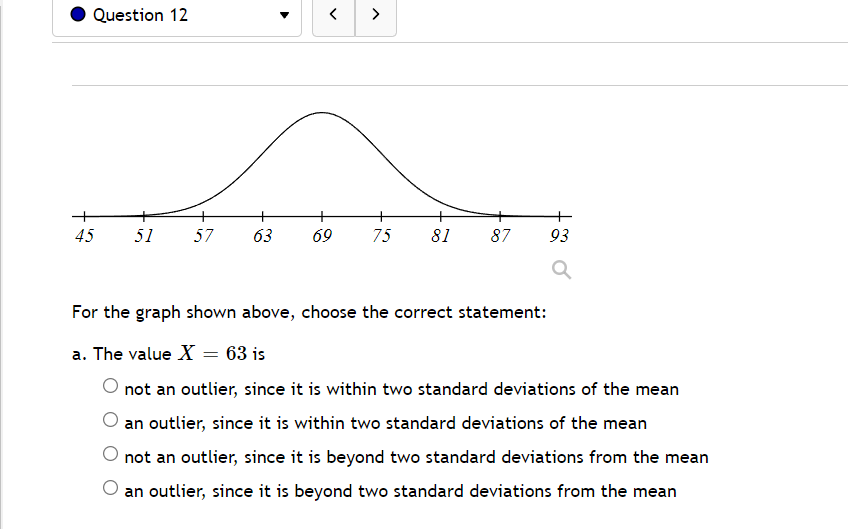
0 Question 12 v 1 _ 'I 45 5.? 5? 63 69 8} 8? 93 For the graph shown above, choose the correct statement: a,

image text in transcribedimage text in transcribedimage text in transcribed
0 Question 12 v "\"1 _ 'I 45 5.? 5? 63 69 8} 8? 93 For the graph shown above, choose the correct statement: a, The value X = 63 is '33:} not an outlier, since it is within two standard deviations of the mean '33:} an outlier, since it is within two standard deviations of the mean '33:} not an outlier, since it is beyond two standard deviations from the mean '33:} an outlier, since it is beyond two standard deviations from the mean Question 13 34 44 54 64 74 84 94 104 114 Exam Scores Q For the graph shown above, what is the percentile of a score of 74 points? Use values from the Empirical Rule.. Question 14 > + 59 62 65 68 71 74 77 80 83 Exam Scores Q For the graph shown above, a. what is the Z-value of a score of 77 points? b. What exam score corresonds to Z = 1

Step by Step Solution

There are 3 Steps involved in it

Step: 1

blur-text-image

Get Instant Access to Expert-Tailored Solutions

See step-by-step solutions with expert insights and AI powered tools for academic success

Step: 2

blur-text-image

Step: 3

blur-text-image

Ace Your Homework with AI

Get the answers you need in no time with our AI-driven, step-by-step assistance

Get Started

Recommended Textbook for

Calculus

Authors: Jon Rogawski, Colin Adams, Robert Franzosa

4th Edition

1319055842, 9781319055844

More Books

Students also viewed these Mathematics questions

Question

What role do hormone levels play in mood?

Answered: 1 week ago