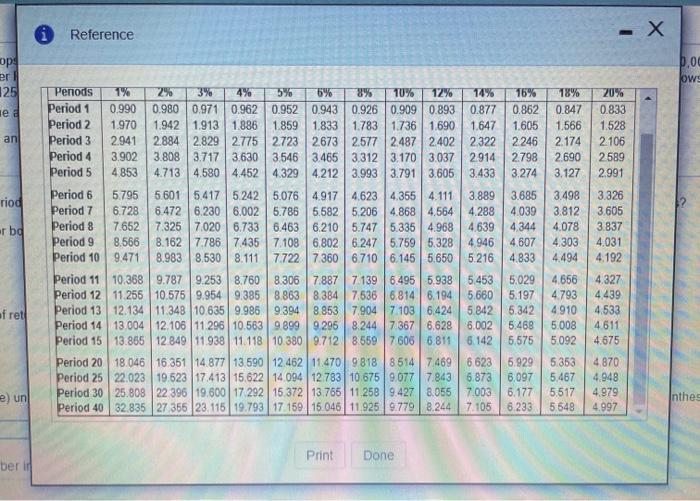
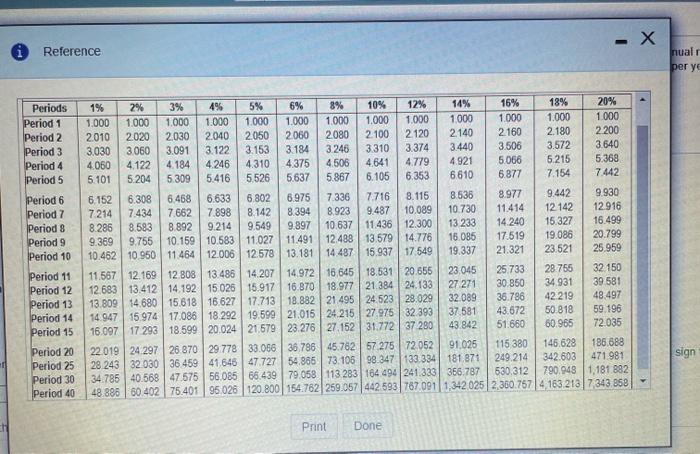
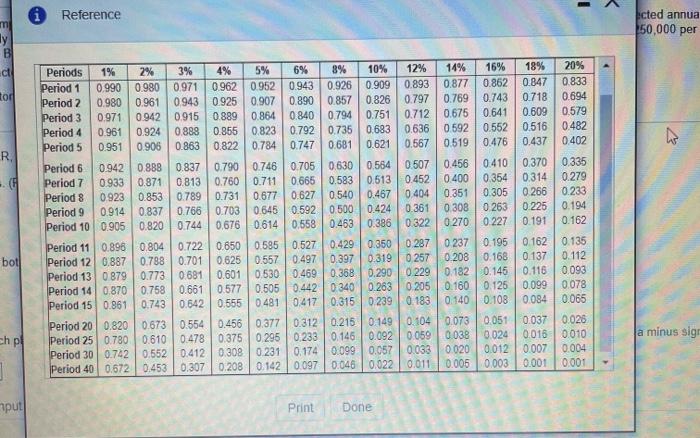
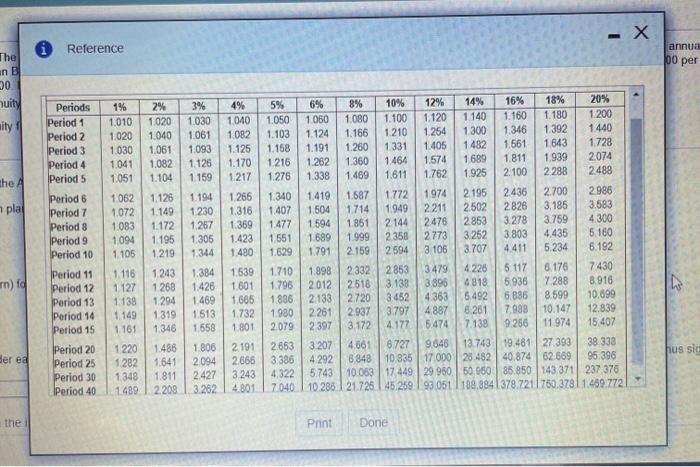
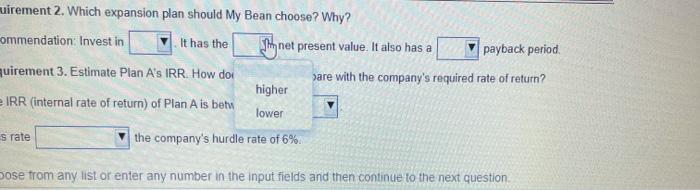
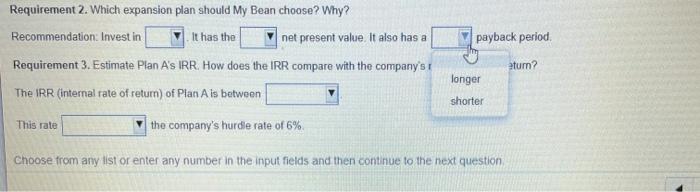
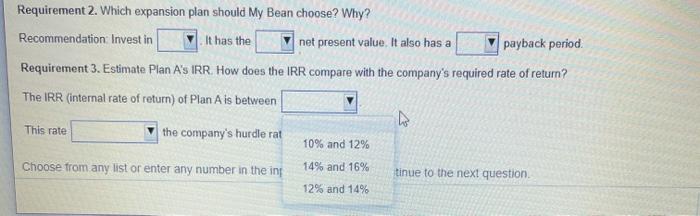
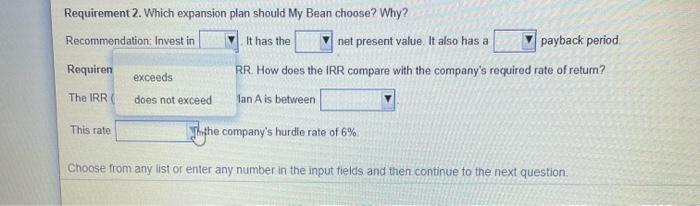
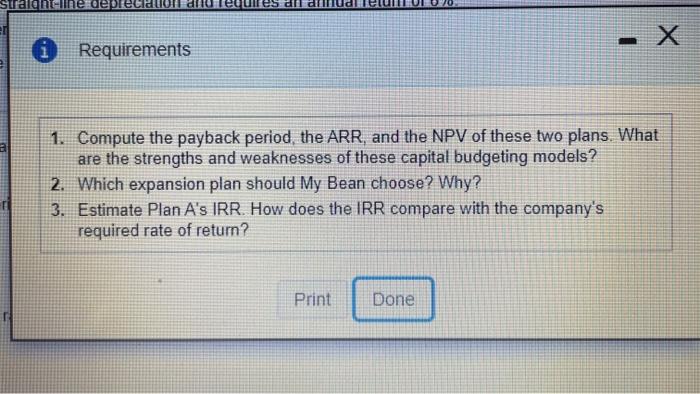
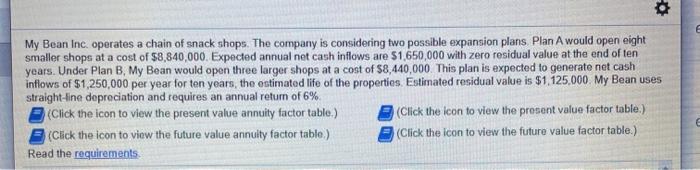
0 Reference er bod Ows 125 16% 0.862 1.605 2 246 2.798 3274 18% 0.847 1.566 2.174 2.690 3.127 20% 0.833 1.528 2106 2589 2991 an riod er bg Periods 25 5% 5% 8% 10% 12% Period 1 0.990 0.980 0,971 0.962 0.952 0.943 0.926 0.909 0.893 0.877 Period 2 1.970 1.942 1.913 1.886 1.859 1.833 1.783 1736 1.690 1.647 Period 3 2.941 2.884 2.8292775 2.723 2673 2577 2.487 24022322 Period 4 3.902 3.808 3.717 3630 3.546 3.465 3.312 3.170 3.037 2.914 Period 5 4853 4.713 4.580 4.452 4.329 4.212 3.993 3.791 3.605 3.433 Period 6 5.795 5 601 5.417 5.2425.076 4.917 4.623 4.355 4.111 3.889 Period 7 6.728 6.472 6.230 6.002 5.786 5.582 5,206 4.868 4.564 4.288 Period 8 7.652 7.325 7.0206.733 6.463 6210 5.747 5.335 4.968 4.639 Period 9 8.566 8.162 7.786 7.435 7 108 6.8026.247 5.759 5.3284946 Period 10 9.471 8.983 8.530 8.111 7.7227.360 6.710 6.145 5.6505.216 Period 11 10.368 9.787 9.253 8.760 8.306 7.8877.139 6.495 5.938 5.453 Period 12 11.256 10.575 9.954 9.385 8.863 8.384 7.536 6.814 6.1945.660 Period 13 12.134 11.348 10.635 9.986 9.39488537 904 7 103 6.424 5.842 Period 14 13.004 12.106 11.296 10.563 9.899 9.295 8.244 7.367 6.628 6.002 Period 15 13.865 12.849 11.938 11.118 10 380 9.7128.55976066811 6.142 Period 20 18.046 16.351 14.877 13.590 12.462 114709 818 8.5147.4696623 Period 25 22.023 19.623 17.413 15.622 14.094 12 783 10,675 9.077 7.8436.873 Period 30 25.808 22 396 19.600 17.292 15.372 13.765 11.2589.427 8055 7.003 Period 40 32.835 27 366 23. 115 19.793 17 159 15 046 11.925 9.7798.244 7.105 3.498 3.812 4.078 4303 4494 3.326 3.605 3.837 4.031 4.192 3.685 4.039 4.344 4.607 4.833 5.029 5.197 5.342 5.468 5,575 of ret 4.656 4793 4910 5.008 5092 4.327 4439 4.533 4611 4.675 6.929 6.097 6.177 8.233 5.353 5.467 5.517 5548 4870 4.948 4.979 4.997 e) un Inthes Print Done berid - X Reference nual per ye Periods Period 1 Period 2 Period 3 Period 4 Period 5 Period 6 Period 7 Period 8 Period 9 Period 10 Period 11 Period 12 Period 13 Period 14 Period 15 Period 20 Period 25 Period 30 Period 40 2% 3% 5% 6% 8% 10% 12% 14% 16% 18% 20% 1.000 1.000 1.000 1.000 1.000 1.000 1.000 1.000 1.000 1000 1.000 1.000 1.000 2010 2020 2.030 2.040 2.050 2060 2.080 2.100 2120 2140 2160 2.180 2 200 3.030 3060 3.091 3.122 3.153 3184 3246 3310 3.374 3.440 3.506 3.572 3.640 4060 4.122 4. 184 4.246 4.310 4375 4506 4641 4.779 4.921 5.066 5.215 5.368 5.101 5 204 5.309 5.416 5.526 5.637 5.867 6.105 6.353 6610 6.877 7.154 7.442 6.152 6.308 6.468 6.633 6.802 6.975 7.336 7716 8.115 8.536 8.977 9.442 9.930 7214 7434 7.662 7.898 8 142 8.394 8.923 9.487 10.089 10.730 11.414 12 142 12916 8.285 8.583 8.892 9.214 9.549 9.897 10.637 11.436 12.300 13 233 14.240 15 327 16.499 9.369 9.755 10.159 10.583 11.027 11.491 12.488 13.579 14.776 16.085 17.519 19.086 20.799 10.462 10 950 11.464 12.006 12.578 13.181 14 48715.93717 549 19.337 21.321 23.521 25.959 11.567 12.169 12 808 13.486 14 207 14.972 16,645 18.53120655 23.045 25.733 28 755 32.150 12.683 13.412 14.192 15 026 15.917 16.870 18.977 21.384 24. 133 27 271 30 850 34.931 39 581 32 089 13.809 14.680 15.618 16.627 17.713 18.882 21.495 24 523 28.029 36.786 42219 48,497 14 94715.974 17.086 18.292 19.599 21.015 24 215 27 975 32 393 37 581 43.672 50 818 59 196 16.097 17 293 18.599 20.024 21.579 23.276 27,152 31772 37 280 43.842 51.660 60.965 72.035 22.019 24 297 26 870 29.778 33.066 36786 45.76257 275 72052 91,025 115 380 145.628 186.688 28 243 32 03036 459 41.646 47 727 54 866 73.106 98.347 133 334 181.871 249.214 342.603 471.981 34.785 40.568 47 575 56,085 66.439 79.058 113283 164 494 241.333 356787 530.312790.943 1,181 882 48.886 60 402 75.40195 026 120.800 154.762259.057 442 593 767 091 1,342 025 2,360.757 4 163.213 7 343.858 sign Print Done - Reference cted annua 150,000 per m ly B al tod 20% 0.833 0.694 0.579 0.482 0.402 R. Periods 1% 2% 3% 4% 5% 6% 8% 10% 12% 14% 16% 18% Period 1 0.990 0.980 0.971 0.962 0.952 0.943 0.926 0.909 0.893 0.877 0.862 0.847 Period 2 0.980 0.961 0.943 0.925 0.9070.890 0.857 0.826 0.797 0.769 0.743 0.718 Period 3 0.971 0.942 0.915 0.889 0.864 0.840 0.794 0.751 0.712 0.675 0.641 0.609 Period 4 0.961 0.924 0.889 0.855 0.823 0.792 0.735 0.683 0.636 0.592 0.552 0.516 Period 5 0.951 0.906 0.863 0.822 0.784 0.747 0.681 0.621 0.567 0.519 0.476 0.437 Period 6 0.942 0.888 0.837 0.790 0.746 0.705 0.630 0.564 0.507 0.456 0.410 0.370 Period 7 0.933 0.871 0.813 0.7600.711 0.665 0.583 0.513 0.452 0400 0.354 0.314 Period 8 0.923 0.853 0.789 0.731 0.677 0.627 0.540 0.467 0.404 0.351 0.305 0.266 Period 9 0.914 0.837 0.766 0.703 0.6450.5920.500 0.424 0.361 0.308 0263 0.225 Period 10 0.905 0.820 0.744 0.676 0.614 0.558 0.463 0.386 0.3220 270 0.227 0.191 Period 11 0.896 0.8040.722 0.650 0.585 0.527 0.429 0.350 0.287 0237 0.195 0.162 Period 12 0.887 0.788 0.701 0.625 0.557 0.497 0.397 0.319 0257 0.208 0.168 0.137 Period 13 0 879 0.773 0.681 0.601 0.530 0.4690.368 0.290 0.229 0.182 0.145 0.116 Period 14 0.870 0.758 0.661 0.577 0.505 0.442 0 340 0.263 0.2050.160 0.125 0.099 Period 15 0.861 0.743 0.642 0.55504810417 0.315 0.239 0.183 0.140 0.108 0.084 Period 20 0.820 0.673 0.554 0.456 0.377 0.312 0.215 0.149 0.104 0.073 0 051 0.037 Period 25 0.780 0.610 0.478 0.375 0.295 0.233 0.146 0.092 0.059 0.038 0.024 0.016 Period 30 0.742 0.5520.412 0.308 0231 0.1740.099 0.057 0.033 0.020 0.012 0.007 Period 40 0.672 0.453 0.307 0.208 0.1420.097 0.046 0.022 0.011 0.006 0.003 0.001 0335 0.279 0.233 0.194 0.162 boll 0.135 0.112 0 093 0 078 0.065 a minus sign chef 0.026 0.010 0.004 0.001 ] put Print Done -X i Reference annua 00 per The en B 20 uity mity 1 1% 1.010 1.020 1.030 1.041 1.051 2% 1.020 1040 1.061 1.082 1.104 3% 1.030 1061 1.093 1.126 1.159 the A pla 1.062 1072 1.083 1094 Periods Period 1 Period 2 Period 3 Period 4 Period 5 Period 6 Period 7 Period 8 Period 9 Period 10 Period 11 Period 12 Period 13 Period 14 Period 15 Period 20 Period 25 Period 30 Period 40 1.126 1.149 1.172 1.195 1219 1.194 1230 1257 1.305 1.344 5% 6% 8% 10% 12% 14% 16% 18% 20% 1.050 1050 1080 1.100 1.120 1140 1.160 1.180 1.200 1.103 1.124 1.166 1210 1254 1300 1,346 1 392 1.440 1.158 1.191 1.260 1331 1.405 1482 1.561 1643 1.728 1216 1.262 1.360 1.464 1.574 1 689 1.811 1.939 2.074 1.276 1.338 1.469 1.611 1.762 1925 2.100 2.288 2.488 1.340 1.419 1.687 1772 1974 2195 2436 2.700 2986 1.407 1.504 1714 1949 2211 2.502 2 826 3,185 3.583 1.477 1594 1.851 2144 2476 2853 3.278 3.759 4.300 1.551 1.689 1.999 2358 2773 3.252 3.803 4.435 5160 1.629 1.791 2.159 2594 3 106 3.707 4411 5.234 6.192 1.710 1.898 2332 2853 3.479 4.226 5.117 6.176 7.430 1.796 2012 2518 3.138 3896 4818 5.936 7.288 8.916 1886 2133 2.720 3.452 4363 6492 6.886 8.599 10.699 1.980 2261 2.937 3.797 4887 6.261 7.988 10.147 12.839 2079 2397 3. 172 4.177 5.474 7.138 9256 11 974 15.407 2653 3207 4661 6.727 9.646 13.743 19481 27 393 38 338 3386 4292 8848 10 83517.000 28.462 40.87462.669 95 396 4322 5.743 10 063 17 449 29 960 50.050 85.850 143,371 237376 7040 10 286 1 21.725 45.259 93.051 1188,884378.721/ 750.3781 1.469.772 1040 1.082 1.125 1.170 1217 1266 1.316 1.369 1.423 1.480 1.539 1.601 1.665 1.732 1801 2191 2666 3.243 4.801 1.105 rn) io 1.116 1127 1138 1.149 1.165 1243 1268 1294 1319 1 346 1.486 1641 1.811 2209 1.384 1.426 1469 1513 1658 1.806 2.094 2.427 3.282 1220 hus sio er eg 1 282 1348 1489 the Print Done My Bean Inc operates a chain of snack shops. The company is considering two possible expansion plans Plan A would open eight smaller shops at a cost of 58,840,000 Expected annual net cash inflows are $1,650,000 with zero residual value at the end of ten years. Under Plan B, My Bean would open three larger shops at a cost of $8,440,000 This plan is expeded to generate nel cash inflows of S1 250 000 per year for ten years, the estimated life of the properties. Estimated residual value is $1.125,000 My Bean uses straight-line depreciation and requires an annual return of 6% (Click the icon to view the present value annuity factor table.) (Click the icon to view the present value factor table.) (Click the icon to view the future value annuity factor table.) (Click the icon to view the future value factor table.) Read the requirements Requirement 1. Compute the payback period the ARR, and the NPV of these two plans What are the strengths and weaknesses of these capital budgeting models? Begin by computing the payback period for both plans. (Round your answers to one decimal place) Plan A (in years) Plan B (in years) Now compute the ARR (accounting rate of return) for both plans. (Round the percentages to the nearest tenth percent.) Plan A % Plan B % Choose from any list or enter any number in the input Delds and then continue to the next question Match the term with the strengths and weaknesses listed for each of the three capital budgeting models Capital budgeting models Strengths and weaknesses is based on cash flows, can be used to assess profitability, and takes into account the time value of money. It has none of the weaknesses of the other two models. Is easy to understand, is based on cash flows, and highlights risks. However, it Ignores profitability and the time value of money. Can be used to assess profitability, but it ignores the time value of money. Requirement 2. Which expansion plan should My Bean choose? Why? Recommendation Invest in It has the net presont value. It also has a payback period Choose from any list or enter any number in the input fields and then continue to the next question Read the requirements Is easy to understand, is based on cash flows, and highlights risks. However, it ignores profitability and the time value of money. Can be used to assess profitability, but it ignores the time value of money. Requirement 2. Which expansion plan should My Bean choose? Why? Recommendation Invest in It has the net present value. It also has a payback period Requirement 3. Estimate PL does the IRR compare with the company's required rate of riptum? Plan A The IRR (internal rate of retu between Plan B This rate the company's hurdle rate of 6% Choose from any list or enter any number in the input fields and then continue to the next question payback period Requirement 2. Which expansion plan should My Bean choose? Why? Recommendation: Invest in It has the net present value. It also has a Requirement 3. Estimate Plan A's IRR. How does the IRR compare with the company's The IRR (Internal rate of retum) of Plan A is between aturn? longer shorter This rate the company's hurdle rate of 6% Choose from any list or enter any number in the input fields and then continue to the next question Requirement 2. Which expansion plan should My Bean choose? Why? Recommendation Invest in It has the net present value. It also has a payback period. Requirement 3. Estimate Plan A's IRR How does the IRR compare with the company's required rate of return? The IRR (internal rate of return) of Plan A is between This rate the company's hurdle rat 10% and 12% Choose from any list or enter any number in the in 14% and 16% tinue to the next question 12% and 14% Requirement 2. Which expansion plan should My Bean choose? Why? Recommendation: Invest in It has the net present value. It also has a payback period Requiren exceeds RR. How does the IRR compare with the company's required rate of retum? The IRR does not exceed lan Ais between This rate Thythe company's hurdfe rate of 6% Choose from any list or enter any number in the input fields and then continue to the next question Suraian-line deprecia un all dilhdnud i Requirements - X 1. Compute the payback period, the ARR, and the NPV of these two plans. What are the strengths and weaknesses of these capital budgeting models? 2. Which expansion plan should My Bean choose? Why? 3. Estimate Plan A's IRR. How does the IRR compare with the company's required rate of return? Print Done o My Bean Inc. operates a chain of snack shops. The company is considering two possible expansion plans. Plan A would open eight smaller shops at a cost of $8,840,000. Expected annual net cash inflows are $1,650,000 with zero residual value at the end of ten years. Under Plan B, My Bean would open three larger shops at a cost of $8,440,000 This plan is expected to generate net cash inflows of $1,250,000 per year for ten years, the estimated life of the properties. Estimated residual value is $1. 125.000. My Bean uses straight-line depreciation and requires an annual return of 6% (Click the icon to view the present value annuity factor table.) (Click the icon to view the present value factor table.) (Click the icon to view the future value annuity factor table) (Click the icon to view the future value factor table.) Read the requirements 0 Reference er bod Ows 125 16% 0.862 1.605 2 246 2.798 3274 18% 0.847 1.566 2.174 2.690 3.127 20% 0.833 1.528 2106 2589 2991 an riod er bg Periods 25 5% 5% 8% 10% 12% Period 1 0.990 0.980 0,971 0.962 0.952 0.943 0.926 0.909 0.893 0.877 Period 2 1.970 1.942 1.913 1.886 1.859 1.833 1.783 1736 1.690 1.647 Period 3 2.941 2.884 2.8292775 2.723 2673 2577 2.487 24022322 Period 4 3.902 3.808 3.717 3630 3.546 3.465 3.312 3.170 3.037 2.914 Period 5 4853 4.713 4.580 4.452 4.329 4.212 3.993 3.791 3.605 3.433 Period 6 5.795 5 601 5.417 5.2425.076 4.917 4.623 4.355 4.111 3.889 Period 7 6.728 6.472 6.230 6.002 5.786 5.582 5,206 4.868 4.564 4.288 Period 8 7.652 7.325 7.0206.733 6.463 6210 5.747 5.335 4.968 4.639 Period 9 8.566 8.162 7.786 7.435 7 108 6.8026.247 5.759 5.3284946 Period 10 9.471 8.983 8.530 8.111 7.7227.360 6.710 6.145 5.6505.216 Period 11 10.368 9.787 9.253 8.760 8.306 7.8877.139 6.495 5.938 5.453 Period 12 11.256 10.575 9.954 9.385 8.863 8.384 7.536 6.814 6.1945.660 Period 13 12.134 11.348 10.635 9.986 9.39488537 904 7 103 6.424 5.842 Period 14 13.004 12.106 11.296 10.563 9.899 9.295 8.244 7.367 6.628 6.002 Period 15 13.865 12.849 11.938 11.118 10 380 9.7128.55976066811 6.142 Period 20 18.046 16.351 14.877 13.590 12.462 114709 818 8.5147.4696623 Period 25 22.023 19.623 17.413 15.622 14.094 12 783 10,675 9.077 7.8436.873 Period 30 25.808 22 396 19.600 17.292 15.372 13.765 11.2589.427 8055 7.003 Period 40 32.835 27 366 23. 115 19.793 17 159 15 046 11.925 9.7798.244 7.105 3.498 3.812 4.078 4303 4494 3.326 3.605 3.837 4.031 4.192 3.685 4.039 4.344 4.607 4.833 5.029 5.197 5.342 5.468 5,575 of ret 4.656 4793 4910 5.008 5092 4.327 4439 4.533 4611 4.675 6.929 6.097 6.177 8.233 5.353 5.467 5.517 5548 4870 4.948 4.979 4.997 e) un Inthes Print Done berid - X Reference nual per ye Periods Period 1 Period 2 Period 3 Period 4 Period 5 Period 6 Period 7 Period 8 Period 9 Period 10 Period 11 Period 12 Period 13 Period 14 Period 15 Period 20 Period 25 Period 30 Period 40 2% 3% 5% 6% 8% 10% 12% 14% 16% 18% 20% 1.000 1.000 1.000 1.000 1.000 1.000 1.000 1.000 1.000 1000 1.000 1.000 1.000 2010 2020 2.030 2.040 2.050 2060 2.080 2.100 2120 2140 2160 2.180 2 200 3.030 3060 3.091 3.122 3.153 3184 3246 3310 3.374 3.440 3.506 3.572 3.640 4060 4.122 4. 184 4.246 4.310 4375 4506 4641 4.779 4.921 5.066 5.215 5.368 5.101 5 204 5.309 5.416 5.526 5.637 5.867 6.105 6.353 6610 6.877 7.154 7.442 6.152 6.308 6.468 6.633 6.802 6.975 7.336 7716 8.115 8.536 8.977 9.442 9.930 7214 7434 7.662 7.898 8 142 8.394 8.923 9.487 10.089 10.730 11.414 12 142 12916 8.285 8.583 8.892 9.214 9.549 9.897 10.637 11.436 12.300 13 233 14.240 15 327 16.499 9.369 9.755 10.159 10.583 11.027 11.491 12.488 13.579 14.776 16.085 17.519 19.086 20.799 10.462 10 950 11.464 12.006 12.578 13.181 14 48715.93717 549 19.337 21.321 23.521 25.959 11.567 12.169 12 808 13.486 14 207 14.972 16,645 18.53120655 23.045 25.733 28 755 32.150 12.683 13.412 14.192 15 026 15.917 16.870 18.977 21.384 24. 133 27 271 30 850 34.931 39 581 32 089 13.809 14.680 15.618 16.627 17.713 18.882 21.495 24 523 28.029 36.786 42219 48,497 14 94715.974 17.086 18.292 19.599 21.015 24 215 27 975 32 393 37 581 43.672 50 818 59 196 16.097 17 293 18.599 20.024 21.579 23.276 27,152 31772 37 280 43.842 51.660 60.965 72.035 22.019 24 297 26 870 29.778 33.066 36786 45.76257 275 72052 91,025 115 380 145.628 186.688 28 243 32 03036 459 41.646 47 727 54 866 73.106 98.347 133 334 181.871 249.214 342.603 471.981 34.785 40.568 47 575 56,085 66.439 79.058 113283 164 494 241.333 356787 530.312790.943 1,181 882 48.886 60 402 75.40195 026 120.800 154.762259.057 442 593 767 091 1,342 025 2,360.757 4 163.213 7 343.858 sign Print Done - Reference cted annua 150,000 per m ly B al tod 20% 0.833 0.694 0.579 0.482 0.402 R. Periods 1% 2% 3% 4% 5% 6% 8% 10% 12% 14% 16% 18% Period 1 0.990 0.980 0.971 0.962 0.952 0.943 0.926 0.909 0.893 0.877 0.862 0.847 Period 2 0.980 0.961 0.943 0.925 0.9070.890 0.857 0.826 0.797 0.769 0.743 0.718 Period 3 0.971 0.942 0.915 0.889 0.864 0.840 0.794 0.751 0.712 0.675 0.641 0.609 Period 4 0.961 0.924 0.889 0.855 0.823 0.792 0.735 0.683 0.636 0.592 0.552 0.516 Period 5 0.951 0.906 0.863 0.822 0.784 0.747 0.681 0.621 0.567 0.519 0.476 0.437 Period 6 0.942 0.888 0.837 0.790 0.746 0.705 0.630 0.564 0.507 0.456 0.410 0.370 Period 7 0.933 0.871 0.813 0.7600.711 0.665 0.583 0.513 0.452 0400 0.354 0.314 Period 8 0.923 0.853 0.789 0.731 0.677 0.627 0.540 0.467 0.404 0.351 0.305 0.266 Period 9 0.914 0.837 0.766 0.703 0.6450.5920.500 0.424 0.361 0.308 0263 0.225 Period 10 0.905 0.820 0.744 0.676 0.614 0.558 0.463 0.386 0.3220 270 0.227 0.191 Period 11 0.896 0.8040.722 0.650 0.585 0.527 0.429 0.350 0.287 0237 0.195 0.162 Period 12 0.887 0.788 0.701 0.625 0.557 0.497 0.397 0.319 0257 0.208 0.168 0.137 Period 13 0 879 0.773 0.681 0.601 0.530 0.4690.368 0.290 0.229 0.182 0.145 0.116 Period 14 0.870 0.758 0.661 0.577 0.505 0.442 0 340 0.263 0.2050.160 0.125 0.099 Period 15 0.861 0.743 0.642 0.55504810417 0.315 0.239 0.183 0.140 0.108 0.084 Period 20 0.820 0.673 0.554 0.456 0.377 0.312 0.215 0.149 0.104 0.073 0 051 0.037 Period 25 0.780 0.610 0.478 0.375 0.295 0.233 0.146 0.092 0.059 0.038 0.024 0.016 Period 30 0.742 0.5520.412 0.308 0231 0.1740.099 0.057 0.033 0.020 0.012 0.007 Period 40 0.672 0.453 0.307 0.208 0.1420.097 0.046 0.022 0.011 0.006 0.003 0.001 0335 0.279 0.233 0.194 0.162 boll 0.135 0.112 0 093 0 078 0.065 a minus sign chef 0.026 0.010 0.004 0.001 ] put Print Done -X i Reference annua 00 per The en B 20 uity mity 1 1% 1.010 1.020 1.030 1.041 1.051 2% 1.020 1040 1.061 1.082 1.104 3% 1.030 1061 1.093 1.126 1.159 the A pla 1.062 1072 1.083 1094 Periods Period 1 Period 2 Period 3 Period 4 Period 5 Period 6 Period 7 Period 8 Period 9 Period 10 Period 11 Period 12 Period 13 Period 14 Period 15 Period 20 Period 25 Period 30 Period 40 1.126 1.149 1.172 1.195 1219 1.194 1230 1257 1.305 1.344 5% 6% 8% 10% 12% 14% 16% 18% 20% 1.050 1050 1080 1.100 1.120 1140 1.160 1.180 1.200 1.103 1.124 1.166 1210 1254 1300 1,346 1 392 1.440 1.158 1.191 1.260 1331 1.405 1482 1.561 1643 1.728 1216 1.262 1.360 1.464 1.574 1 689 1.811 1.939 2.074 1.276 1.338 1.469 1.611 1.762 1925 2.100 2.288 2.488 1.340 1.419 1.687 1772 1974 2195 2436 2.700 2986 1.407 1.504 1714 1949 2211 2.502 2 826 3,185 3.583 1.477 1594 1.851 2144 2476 2853 3.278 3.759 4.300 1.551 1.689 1.999 2358 2773 3.252 3.803 4.435 5160 1.629 1.791 2.159 2594 3 106 3.707 4411 5.234 6.192 1.710 1.898 2332 2853 3.479 4.226 5.117 6.176 7.430 1.796 2012 2518 3.138 3896 4818 5.936 7.288 8.916 1886 2133 2.720 3.452 4363 6492 6.886 8.599 10.699 1.980 2261 2.937 3.797 4887 6.261 7.988 10.147 12.839 2079 2397 3. 172 4.177 5.474 7.138 9256 11 974 15.407 2653 3207 4661 6.727 9.646 13.743 19481 27 393 38 338 3386 4292 8848 10 83517.000 28.462 40.87462.669 95 396 4322 5.743 10 063 17 449 29 960 50.050 85.850 143,371 237376 7040 10 286 1 21.725 45.259 93.051 1188,884378.721/ 750.3781 1.469.772 1040 1.082 1.125 1.170 1217 1266 1.316 1.369 1.423 1.480 1.539 1.601 1.665 1.732 1801 2191 2666 3.243 4.801 1.105 rn) io 1.116 1127 1138 1.149 1.165 1243 1268 1294 1319 1 346 1.486 1641 1.811 2209 1.384 1.426 1469 1513 1658 1.806 2.094 2.427 3.282 1220 hus sio er eg 1 282 1348 1489 the Print Done My Bean Inc operates a chain of snack shops. The company is considering two possible expansion plans Plan A would open eight smaller shops at a cost of 58,840,000 Expected annual net cash inflows are $1,650,000 with zero residual value at the end of ten years. Under Plan B, My Bean would open three larger shops at a cost of $8,440,000 This plan is expeded to generate nel cash inflows of S1 250 000 per year for ten years, the estimated life of the properties. Estimated residual value is $1.125,000 My Bean uses straight-line depreciation and requires an annual return of 6% (Click the icon to view the present value annuity factor table.) (Click the icon to view the present value factor table.) (Click the icon to view the future value annuity factor table.) (Click the icon to view the future value factor table.) Read the requirements Requirement 1. Compute the payback period the ARR, and the NPV of these two plans What are the strengths and weaknesses of these capital budgeting models? Begin by computing the payback period for both plans. (Round your answers to one decimal place) Plan A (in years) Plan B (in years) Now compute the ARR (accounting rate of return) for both plans. (Round the percentages to the nearest tenth percent.) Plan A % Plan B % Choose from any list or enter any number in the input Delds and then continue to the next question Match the term with the strengths and weaknesses listed for each of the three capital budgeting models Capital budgeting models Strengths and weaknesses is based on cash flows, can be used to assess profitability, and takes into account the time value of money. It has none of the weaknesses of the other two models. Is easy to understand, is based on cash flows, and highlights risks. However, it Ignores profitability and the time value of money. Can be used to assess profitability, but it ignores the time value of money. Requirement 2. Which expansion plan should My Bean choose? Why? Recommendation Invest in It has the net presont value. It also has a payback period Choose from any list or enter any number in the input fields and then continue to the next question Read the requirements Is easy to understand, is based on cash flows, and highlights risks. However, it ignores profitability and the time value of money. Can be used to assess profitability, but it ignores the time value of money. Requirement 2. Which expansion plan should My Bean choose? Why? Recommendation Invest in It has the net present value. It also has a payback period Requirement 3. Estimate PL does the IRR compare with the company's required rate of riptum? Plan A The IRR (internal rate of retu between Plan B This rate the company's hurdle rate of 6% Choose from any list or enter any number in the input fields and then continue to the next question payback period Requirement 2. Which expansion plan should My Bean choose? Why? Recommendation: Invest in It has the net present value. It also has a Requirement 3. Estimate Plan A's IRR. How does the IRR compare with the company's The IRR (Internal rate of retum) of Plan A is between aturn? longer shorter This rate the company's hurdle rate of 6% Choose from any list or enter any number in the input fields and then continue to the next question Requirement 2. Which expansion plan should My Bean choose? Why? Recommendation Invest in It has the net present value. It also has a payback period. Requirement 3. Estimate Plan A's IRR How does the IRR compare with the company's required rate of return? The IRR (internal rate of return) of Plan A is between This rate the company's hurdle rat 10% and 12% Choose from any list or enter any number in the in 14% and 16% tinue to the next question 12% and 14% Requirement 2. Which expansion plan should My Bean choose? Why? Recommendation: Invest in It has the net present value. It also has a payback period Requiren exceeds RR. How does the IRR compare with the company's required rate of retum? The IRR does not exceed lan Ais between This rate Thythe company's hurdfe rate of 6% Choose from any list or enter any number in the input fields and then continue to the next question Suraian-line deprecia un all dilhdnud i Requirements - X 1. Compute the payback period, the ARR, and the NPV of these two plans. What are the strengths and weaknesses of these capital budgeting models? 2. Which expansion plan should My Bean choose? Why? 3. Estimate Plan A's IRR. How does the IRR compare with the company's required rate of return? Print Done o My Bean Inc. operates a chain of snack shops. The company is considering two possible expansion plans. Plan A would open eight smaller shops at a cost of $8,840,000. Expected annual net cash inflows are $1,650,000 with zero residual value at the end of ten years. Under Plan B, My Bean would open three larger shops at a cost of $8,440,000 This plan is expected to generate net cash inflows of $1,250,000 per year for ten years, the estimated life of the properties. Estimated residual value is $1. 125.000. My Bean uses straight-line depreciation and requires an annual return of 6% (Click the icon to view the present value annuity factor table.) (Click the icon to view the present value factor table.) (Click the icon to view the future value annuity factor table) (Click the icon to view the future value factor table.) Read the requirements