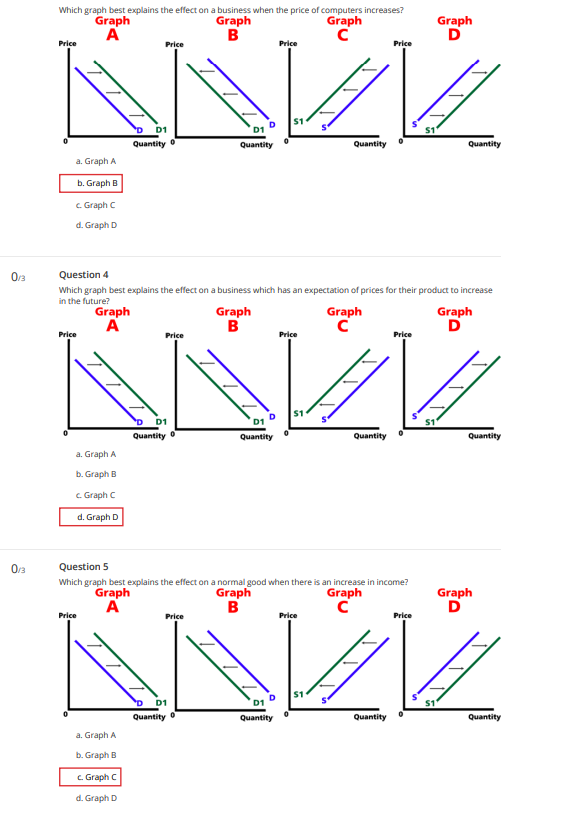
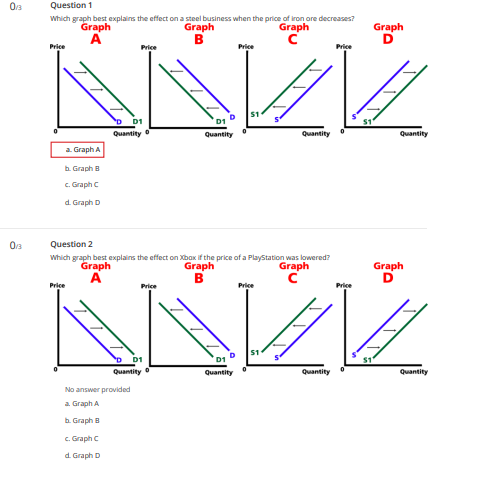
03 Question 1 Which graph best explains the effect on a steel business when the price of Iron ore decreases? Graph Graph Graph Graph A
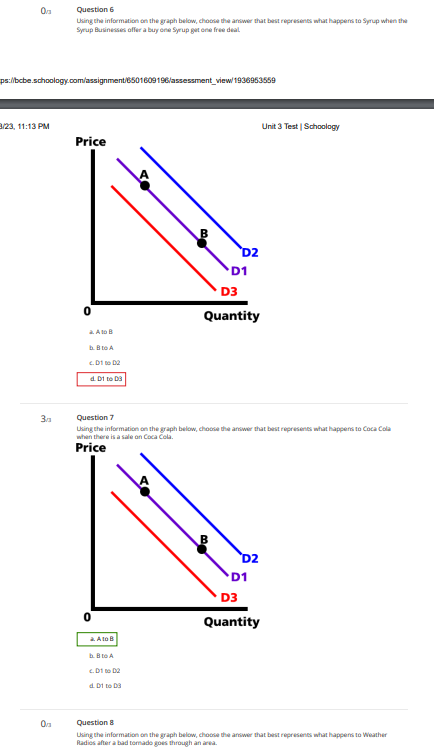
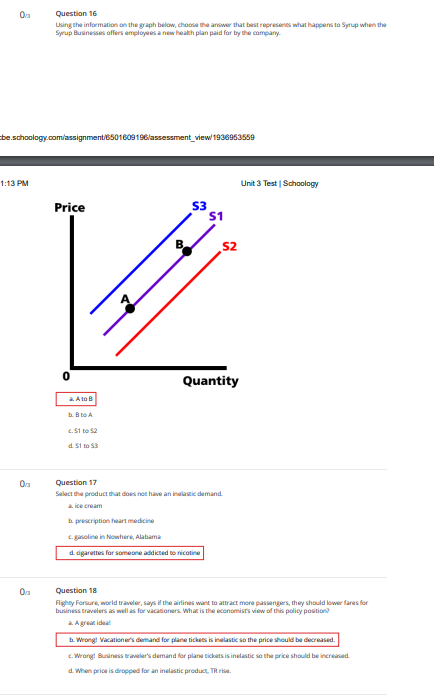
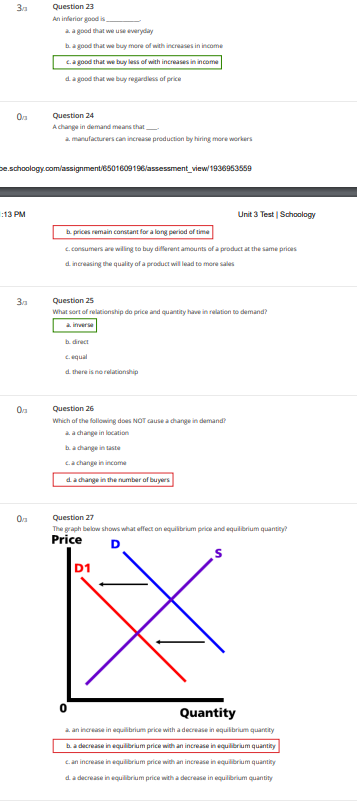
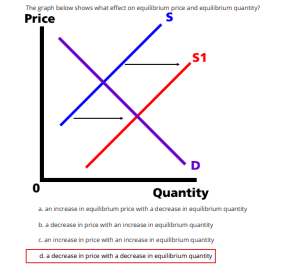
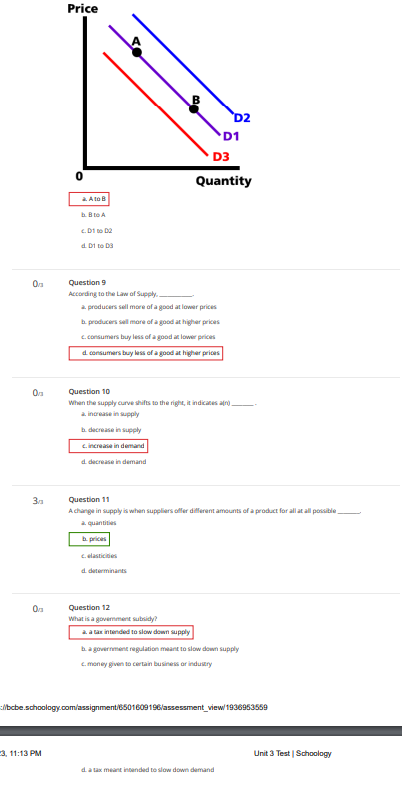
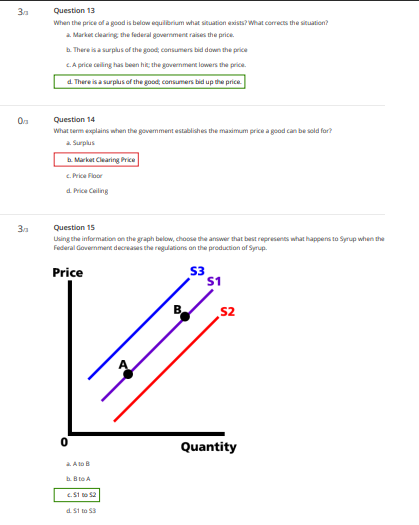
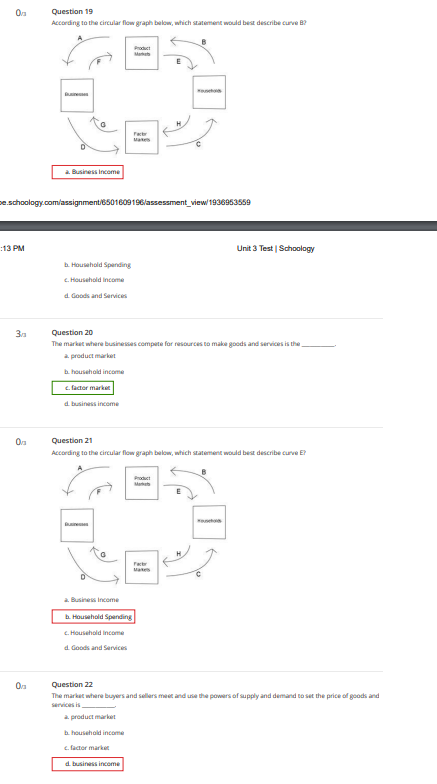
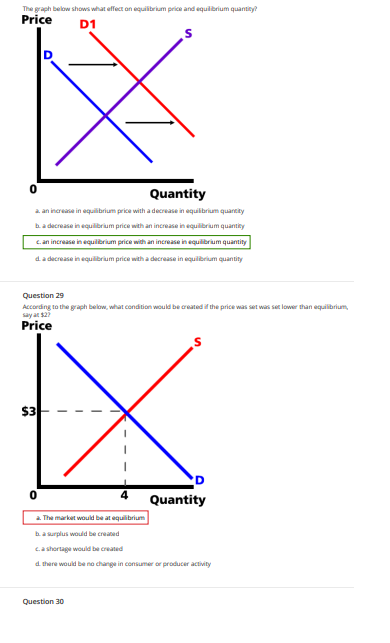
03 Question 1 Which graph best explains the effect on a steel business when the price of Iron ore decreases? Graph Graph Graph Graph A B C D Price Price Price Price 51 01 Quantity D quantity A. GraphA b. Graph B c. Graph C d Graph D Question 2 Which graph best explains the effect on Xbox if the price of a PlayStation was lowered? Graph Graph Graph Graph A B C D Price Price Price Price 51 D1 Quantity D quantity No answer provided a. Graph A b. Graph B c. Graph C d Graph DWhich graph best explains the effect on a business when the price of computers increases? Graph Graph Graph Graph A B C D Price Price Price Price 51 D1 51 Quantity 0 quantity Quantity Quantity a. Graph A b. Graph B C. Graph C d. Graph D 0/3 Question 4 Which graph best explains the effect on a business which has an expectation of prices for their product to increase in the future? Graph Graph Graph Graph A B C D Price Price Price Price S D1 01 Quantity Q Quantity Quantity Quantity a. Graph A b. Graph B C. Graph C d. Graph D 0/3 Question 5 Which graph best explains the effect on a normal good when there is an increase in income? Graph Graph Graph Graph A B C D Price Price Price Price 51 S D1 01 Quantity Quantity Quantity Quantity a. Graph A b. Graph B c. Graph C d. Graph DQuestion 6 Lking the information on the graph below, choose the arrower that bast represents what happen to Syrup when the Syrup Businesses offer a buy one Syrup part one free deal ps:ibcbe.schoologycom/assignment/6501609196/assessment_view1936963659 1/23, 11:13 PM Unit 3 Test | Schoology Price D2 D1 D3 Quantity A AID B Question 7 Lking the information on the graph below, choose the arrower that bast represents what happens to Coca Cola whan there is a sale on Coca Cola. Price D2 D1 D3 Quantity A. AID B b.B DGA. C. Di BG D2 Question : Liking the information on the graph below, choose the arrower that bust represents what happens to Weather Radios after a bad tornado goes through an arma.Price D2 D1 D3 0 Quantity L. BIGA. C. Di no D2 d. Di Da Da Question 9 According to the Law of Supply.. a producers sell more of a good at lower prices b. producers still more of agood at higher prices c. consumers buy loss of a good at lower prices d. consumers buy lass of a good at higher prices Question 10 Whan the supply curve shifts in the right, it indicates ajrj a increase in supply b. docrease in supply c. increase in demand d. docrease in demand Question 11 A change in supply is whan suppliers oller different amounts of a product for all at all possible d. determinants Question 12 What is a joviment subsidy? a a bit intended to slow down supply be agovernment regulation maint to slow down supply c. money givin in certain business or industry odbcbe.schoology.com/assignment/6501609 196/assessment_view/1936953559 3, 11:13 PM Unit 3 Test | Schoology d. a lax meant inbanded to slow down damand3.m Question 13 Whan the price of a good is below equilibrium what situation exists? What corrects the situation? a Market clearing the federal government raises the price. b. There is a surplus of the good; consumers bid down the price E. A price chilling has bean hit the gowermant lowers the price. d. There is a surplus of the good; consumers bid up the price. Question 14 What Birm explain whan the goverment establishes the maximum price a good can be sold fort a. Surplus b. Market Clearing Price c. Price Floor d. Price Ceiling Question 15 Lking the information on the graph below, choose the arrower that bait represents what happen to Syrup when the Federal Government decreases the nigulations on the production of Syrup. Price S1 B $2 0 Quantity A. AID BQuestion 16 Living the information on the graph below, choose the arrower that best represents what happens to Syrup when the Syrup Businesses offers employees a new health plan paid for by the company be.schoologycom/assignment/6501609 196/assessment_view/1936953559 1:13 PM Unit 3 Test | Schoology Price $1 Quantity L.BIGA C. 51 16 52 d.51 1 53 Question 17 Salact ha product that does not have an inalaicic damand. b. proscription hart medicine c. porteline in Nowhere, Alabama d. ogarettes for someone addicted to nicotine Question 18 Flighty Forsure, world traveler, says if the airlines want to attract more passengers, they should lower fares for buriness travelers in will as for vacationars. What is the economists wow of this policy position? i. A great idand b. Wrong! Vacationer's demand for plane tickets is inelastic so the price should be decreased. c. Wrong! Business brawlar's demand for plana bidouts is inelastic so the price should be increased. d. When price is dropped for an inelastic product, Thrive.Question 19 According to the circular flow graph balow, which statement would best describe curve B? Product H a Business Income e.schoologycom/assignment/8501609190/assessment_view1936953559 :13 PM Unit 3 Test | Schoology b. Household Spanding c. Household Income d. Goods and Services Question 20 The market where businesses compete for resources to make goods and services is the A product market b. household income C. factor market d. business income Question 21 According to the circular flow graph balow, which statement would best describe curve Er a Business Income b. Household Spanding c. Household Income d. Goods and Services Question 22 The market where buyers and sellars mast and use the powers of supply and demand to set the price of goods and a product market b. household income c. factor market d. business incomeQuestion 23 An inlarior good is a a good that we use awaryday be good that wa buy more of with increases in income c. a good that webbby loss of with increases in income d a good that wa buy ingandless of price Question 24 A change in demand means that a manufacturers can increase production by hiring more workers be.schoology.com/assignment/6501609196/assessment_view/1936963559 :13 PM Unit 3 Test | Schoology h. prices romain corricant for a long period of time c. consumers are willing to buy dillarant amounts of a product at the same prices d. increasing the quality of a product will lead to more sales 3.a Question 25 What sort of relationship do price and quantity have in malation to damand? c. equal d. there is norelationship Question 26 Which of the following does NOT cause a change in damandt h. a change in location b. a change in lasta c. achange inincome d. a change in the number of buyers Question 27 The graph below shows what affect on equilibrium price and equilibrium quantity? Price D D1 Quantity a an increase in equilibrium price with a decrease in equilibrium quantity b. a decrease in equilibrium price with an increase in equilibrium quantic c. an increase in equilibrium price with an increase in equilibrium quantity d. a decrease in equilibrium price with a decrease in equilibrium quantityThe graph below shows what effect on equilibrium price and equilibrium quantic ? Price D1 D X 0 Quantity a an hor tense in equilibrium price with a decrease in equilibrium quantity badacrease inequilibrium price with an increase in equilibrium quantity C. an increase in equilibrium price with an increase inequilibrium quanting da dachange in equilibrium price with a decrease in equilibrium quantity Question 29 According to the graph below, what condition would be created if the price was sit was set lower than equilibrium, Price $3 D 0 4 Quantity The market would be at equilibrium to surplus would be created c. a shortage would be created d. there would ba no change in consumer or producer activity Question 30The graph below shows what affect on equilibrium price and equilibrium quantic ? Price S $1 D Quantity h an heroine in equilibrium price with a decrease in equilibrium quantity b. a decrease in price with an increase in aquilibrium quantity C. an increase in price with an increase in equilibrium quantity d. a docmasse im price with a decrease in equilibrium quantity
Step by Step Solution
There are 3 Steps involved in it
Step: 1
Get Instant Access to Expert-Tailored Solutions
See step-by-step solutions with expert insights and AI powered tools for academic success
Step: 2
Step: 3
Ace Your Homework with AI
Get the answers you need in no time with our AI-driven, step-by-step assistance