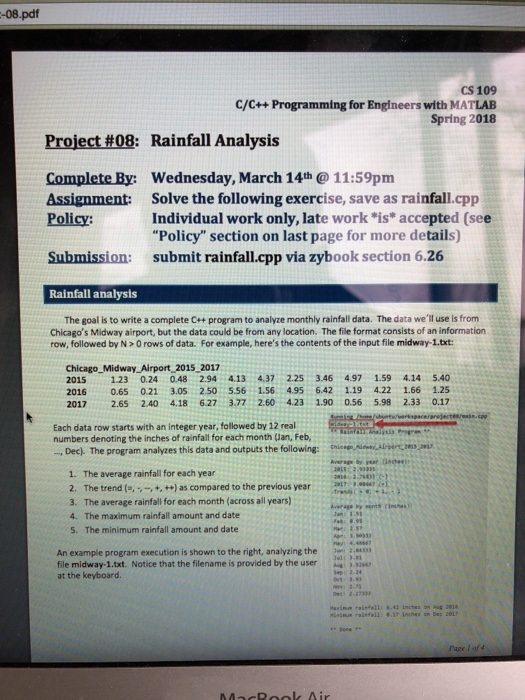
-08.pdf CS 109 C/C++ Programming for Engineers with MATLAB Spring 2018 Project#08: Rainfall Analysis Complete By: Assignment: Policy: Wednesday, March 14th @ 11:59pm Solve the following exercise, save as rainfall.cpp Individual work only, late work "is accepted (see "Policy" section on last page for more details) Submission: submit rainfall.cpp via zybook section 6.26 Rainfall analysis The goal is to write a complete C+ program to analyze monthly rainfall data. The data we'll use is from Chicago's Midway airport, but the data could be from any location. The file format consists of an information row, followed by N 0 rows of data. For example, here's the contents of the input file midway-1.txt Chicago_Midway Airport 2015 2017 2015 1.23 0.24 0.48 2.94 4.13 4.37 2.25 3.46 497 1.59 4.14 5.40 2016 0.65 0.21 3.05 2.50 5561.56 4.95 6.42 1.19 422 1.66 1.25 2017 2.65 2.40 4.18 6273.77 2.60 4.23 1.90 0.56 5.98 233 0.17 Each data row starts with an integer year, followed by 12 real numbers denoting the inches of rainfall for each month (Jan, Feb Dec). The program analyzes this data and outputs the following: i.ms a 1. The average rainfall for each year 2. The trend ( compared to the previous year 3. The average rainfall for each month (across all years) 4. The maximum rainfall amount and date 5. The minimum rainfall amount and date ) 2 433 An example program execution is shown to the right, analyzing the file midway. 1.txt. Notice that the filename is provided by the user at the keyboard. c: 2 2733 raiefall: 7Lnches on Dec 2017 Page l of4 -08.pdf CS 109 C/C++ Programming for Engineers with MATLAB Spring 2018 Project#08: Rainfall Analysis Complete By: Assignment: Policy: Wednesday, March 14th @ 11:59pm Solve the following exercise, save as rainfall.cpp Individual work only, late work "is accepted (see "Policy" section on last page for more details) Submission: submit rainfall.cpp via zybook section 6.26 Rainfall analysis The goal is to write a complete C+ program to analyze monthly rainfall data. The data we'll use is from Chicago's Midway airport, but the data could be from any location. The file format consists of an information row, followed by N 0 rows of data. For example, here's the contents of the input file midway-1.txt Chicago_Midway Airport 2015 2017 2015 1.23 0.24 0.48 2.94 4.13 4.37 2.25 3.46 497 1.59 4.14 5.40 2016 0.65 0.21 3.05 2.50 5561.56 4.95 6.42 1.19 422 1.66 1.25 2017 2.65 2.40 4.18 6273.77 2.60 4.23 1.90 0.56 5.98 233 0.17 Each data row starts with an integer year, followed by 12 real numbers denoting the inches of rainfall for each month (Jan, Feb Dec). The program analyzes this data and outputs the following: i.ms a 1. The average rainfall for each year 2. The trend ( compared to the previous year 3. The average rainfall for each month (across all years) 4. The maximum rainfall amount and date 5. The minimum rainfall amount and date ) 2 433 An example program execution is shown to the right, analyzing the file midway. 1.txt. Notice that the filename is provided by the user at the keyboard. c: 2 2733 raiefall: 7Lnches on Dec 2017 Page l of4