

Answered step by step
Verified Expert Solution
Question
1 Approved Answer
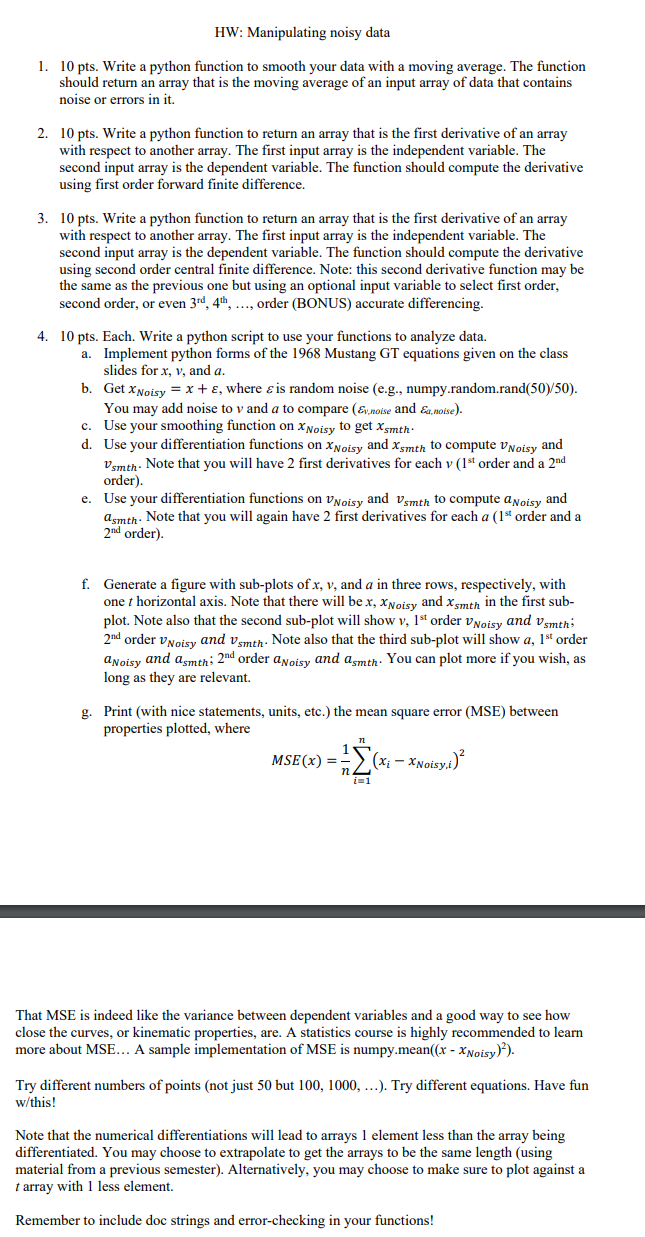
1 0 pts . Write a python function to smooth your data with a moving average. The function should return an array that is the
pts Write a python function to smooth your data with a moving average. The function
should return an array that is the moving average of an input array of data that contains
noise or errors in it
pts Write a python function to return an array that is the first derivative of an array
with respect to another array. The first input array is the independent variable. The
second input array is the dependent variable. The function should compute the derivative
using first order forward finite difference.
pts Write a python function to return an array that is the first derivative of an array
with respect to another array. The first input array is the independent variable. The
second input array is the dependent variable. The function should compute the derivative
using second order central finite difference. Note: this second derivative function may be
the same as the previous one but using an optional input variable to select first order,
second order, or even dots, order BONUS accurate differencing.
pts Each. Write a python script to use your functions to analyze data.
a Implement python forms of the Mustang GT equations given on the class
slides for and
b Get where is random noise eg numpy.random.rand
You may add noise to and to compare and
c Use your smoothing function on to get
d Use your differentiation functions on and to compute and
Note that you will have first derivatives for each order and a
order
e Use your differentiation functions on and to compute and
Note that you will again have first derivatives for each order and a
order
f Generate a figure with subplots of and in three rows, respectively, with
one horizontal axis. Note that there will be and in the first sub
plot. Note also that the second subplot will show order and ;
order and Note also that the third subplot will show order
and ; order and You can plot more if you wish, as
long as they are relevant.
g Print with nice statements, units, etc. the mean square error MSE between
properties plotted, where
MSE
That MSE is indeed like the variance between dependent variables and a good way to see how
close the curves, or kinematic properties, are. A statistics course is highly recommended to learn
more about MSE... A sample implementation of MSE is numpy.mean
Try different numbers of points not just but dots Try different equations. Have fun
wthis
Note that the numerical differentiations will lead to arrays element less than the array being
differentiated. You may choose to extrapolate to get the arrays to be the same length using
material from a previous semester Alternatively, you may choose to make sure to plot against a
array with less element.
Step by Step Solution
There are 3 Steps involved in it
Step: 1

Get Instant Access to Expert-Tailored Solutions
See step-by-step solutions with expert insights and AI powered tools for academic success
Step: 2

Step: 3
Ace Your Homework with AI
Get the answers you need in no time with our AI-driven, step-by-step assistance
Get Started
Public Finance Fundamentals
Authors: K. Moeti
3rd Edition
148512946X, 9781485129462