

Answered step by step
Verified Expert Solution
Question
1 Approved Answer
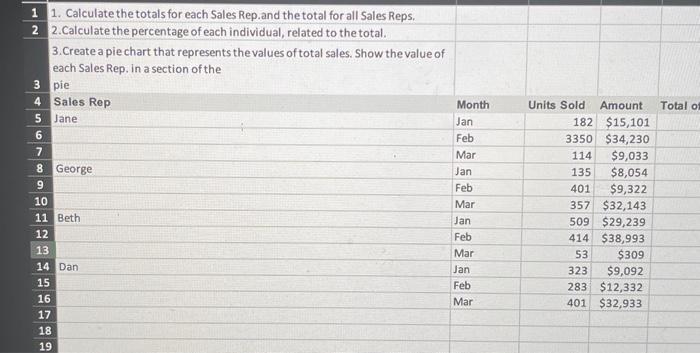
1 1. Calculate the totals for each Sales Rep. and the total for all Sales Reps. 2 2.Calculate the percentage of each individual, related to
Step by Step Solution
There are 3 Steps involved in it
Step: 1

Get Instant Access to Expert-Tailored Solutions
See step-by-step solutions with expert insights and AI powered tools for academic success
Step: 2

Step: 3
Ace Your Homework with AI
Get the answers you need in no time with our AI-driven, step-by-step assistance
Get Started
Auditing and Assurance Services An Applied Approach
Authors: Iris Stuart
1st edition
73404004, 978-0073404004