

Question: 1 12 2 3 4 5 6 7 8 9 10 11 42 12 13 14 15 16 17 A B C Company HP
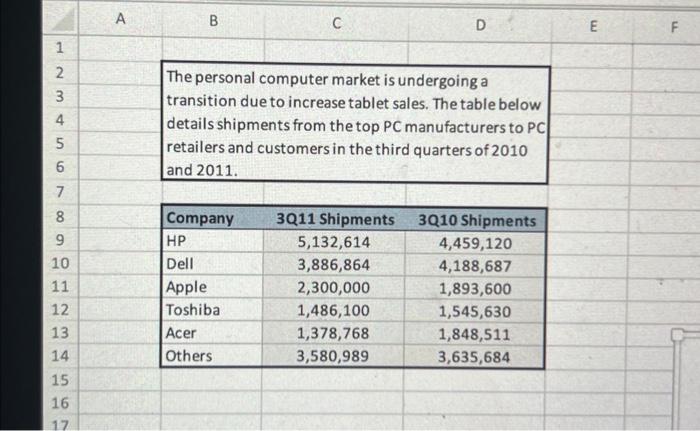
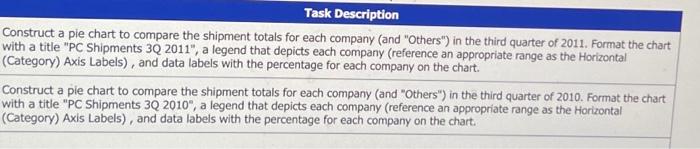
1 12 2 3 4 5 6 7 8 9 10 11 42 12 13 14 15 16 17 A B C Company HP Dell Apple Toshiba Acer Others The personal computer market is undergoing a transition due to increase tablet sales. The table below details shipments from the top PC manufacturers to PC retailers and customers in the third quarters of 2010 and 2011. D 3Q11 Shipments 5,132,614 3,886,864 2,300,000 1,486,100 1,378,768 3,580,989 3Q10 Shipments 4,459,120 4,188,687 1,893,600 1,545,630 1,848,511 3,635,684 E LL F Task Description Construct a pie chart to compare the shipment totals for each company (and "Others") in the third quarter of 2011. Format the chart with a title "PC Shipments 3Q 2011", a legend that depicts each company (reference an appropriate range as the Horizontal (Category) Axis Labels), and data labels with the percentage for each company on the chart. Construct a pie chart to compare the shipment totals for each company (and "Others") in the third quarter of 2010. Format the chart with a title "PC Shipments 3Q 2010", a legend that depicts each company (reference an appropriate range as the Horizontal (Category) Axis Labels), and data labels with the percentage for each company on the chart.
Step by Step Solution
3.44 Rating (151 Votes )
There are 3 Steps involved in it
I have written python code to meet the requirements provided in the image below is the code and desi... View full answer

Get step-by-step solutions from verified subject matter experts