

Answered step by step
Verified Expert Solution
Question
1 Approved Answer
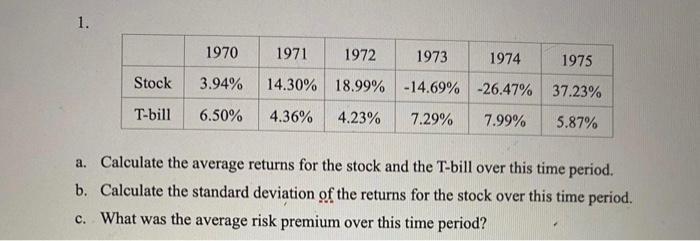
1. 1970 1971 1972 1973 1974 1975 Stock 3.94% 14.30% 18.99% -14.69% -26.47% 37.23% T-bill 6.50% 4.36% 4.23% 7.29% 7.99% 5.87% a. Calculate the average
Step by Step Solution
There are 3 Steps involved in it
Step: 1

Get Instant Access to Expert-Tailored Solutions
See step-by-step solutions with expert insights and AI powered tools for academic success
Step: 2

Step: 3
Ace Your Homework with AI
Get the answers you need in no time with our AI-driven, step-by-step assistance
Get Started
Beyond Bitcoin Economics Of Digital Currencies And Blockchain Technologies
Authors: Hanna Halaburda, Miklos Sarvary, Guillaume Haeringer
2nd Edition
3030889300,3030889319