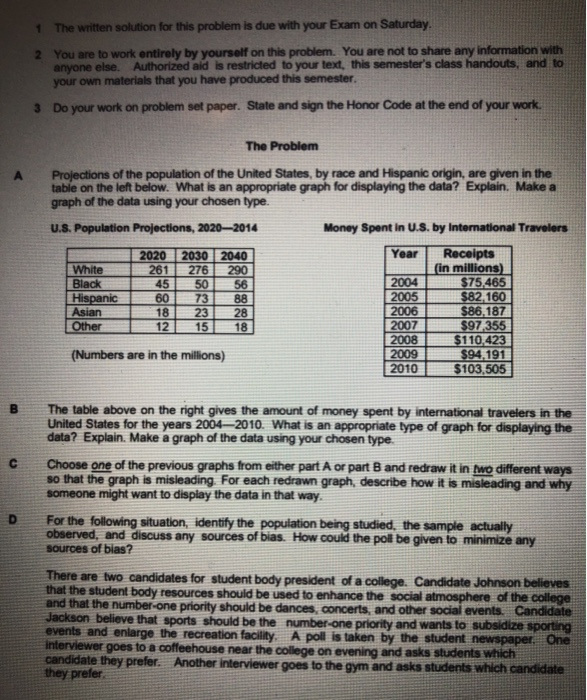
1 2 The written solution for this problem is due with your Exam on Saturday. You are to work entirely by yourself on this problem. You are not to share any information with anyone else. Authorized aid is restricted to your text, this semester's class handouts, and to your own materials that you have produced this semester. Do your work on problem set paper. State and sign the Honor Code at the end of your work The Problem Projections of the population of the United States, by race and Hispanic origin, are given in the table on the left below. What is an appropriate graph for displaying the data? Explain. Make a graph of the data using your chosen type. U.S. Population Projections, 2020-2014 Money Spent in U.S. by International Travelers 2020 2030 2040 Year Receipts White 261 276 290 (in millions) 45 Black 50 2004 56 $75,465 2005 607388 Hispanic $82,160 Asian 2006 $86,187 Other 121 151 2007 $97,355 2008 $110,423 (Numbers are in the millions) 2009 $94.191 20105 103,505 181 243 28 The table above on the right gives the amount of money spent by international travelers in the United States for the years 2004-2010. What is an appropriate type of graph for displaying the data? Explain. Make a graph of the data using your chosen type. Choose one of the previous graphs from either part A or part B and redraw it in two different ways so that the graph is misleading. For each redrawn graph, describe how it is misleading and why someone might want to display the data in that way. For the following situation, identify the population being studied, the sample actually observed, and discuss any sources of bias. How could the poll be given to minimize any sources of bias? There are two candidates for student body president of a college, Candidate Johnson believes that the student body resources should be used to enhance the social atmosphere of the college and that the number-one priority should be dances, concerts, and other social events. Candidate Jackson believe that sports should be the number one priority and wants to subsidize sporting events and enlarge the recreation facility. A poll is taken by the student newspaper One Interviewer goes to a coffeehouse near the college on evening and asks students which candidate they prefer. Another interviewer goes to the gym and asks students which candidate they prefer 1 2 The written solution for this problem is due with your Exam on Saturday. You are to work entirely by yourself on this problem. You are not to share any information with anyone else. Authorized aid is restricted to your text, this semester's class handouts, and to your own materials that you have produced this semester. Do your work on problem set paper. State and sign the Honor Code at the end of your work The Problem Projections of the population of the United States, by race and Hispanic origin, are given in the table on the left below. What is an appropriate graph for displaying the data? Explain. Make a graph of the data using your chosen type. U.S. Population Projections, 2020-2014 Money Spent in U.S. by International Travelers 2020 2030 2040 Year Receipts White 261 276 290 (in millions) 45 Black 50 2004 56 $75,465 2005 607388 Hispanic $82,160 Asian 2006 $86,187 Other 121 151 2007 $97,355 2008 $110,423 (Numbers are in the millions) 2009 $94.191 20105 103,505 181 243 28 The table above on the right gives the amount of money spent by international travelers in the United States for the years 2004-2010. What is an appropriate type of graph for displaying the data? Explain. Make a graph of the data using your chosen type. Choose one of the previous graphs from either part A or part B and redraw it in two different ways so that the graph is misleading. For each redrawn graph, describe how it is misleading and why someone might want to display the data in that way. For the following situation, identify the population being studied, the sample actually observed, and discuss any sources of bias. How could the poll be given to minimize any sources of bias? There are two candidates for student body president of a college, Candidate Johnson believes that the student body resources should be used to enhance the social atmosphere of the college and that the number-one priority should be dances, concerts, and other social events. Candidate Jackson believe that sports should be the number one priority and wants to subsidize sporting events and enlarge the recreation facility. A poll is taken by the student newspaper One Interviewer goes to a coffeehouse near the college on evening and asks students which candidate they prefer. Another interviewer goes to the gym and asks students which candidate they prefer