

1 2 This table is a probability mass function (pmf) for the age residents of Orange County, NC based on the 2010 census. Orange
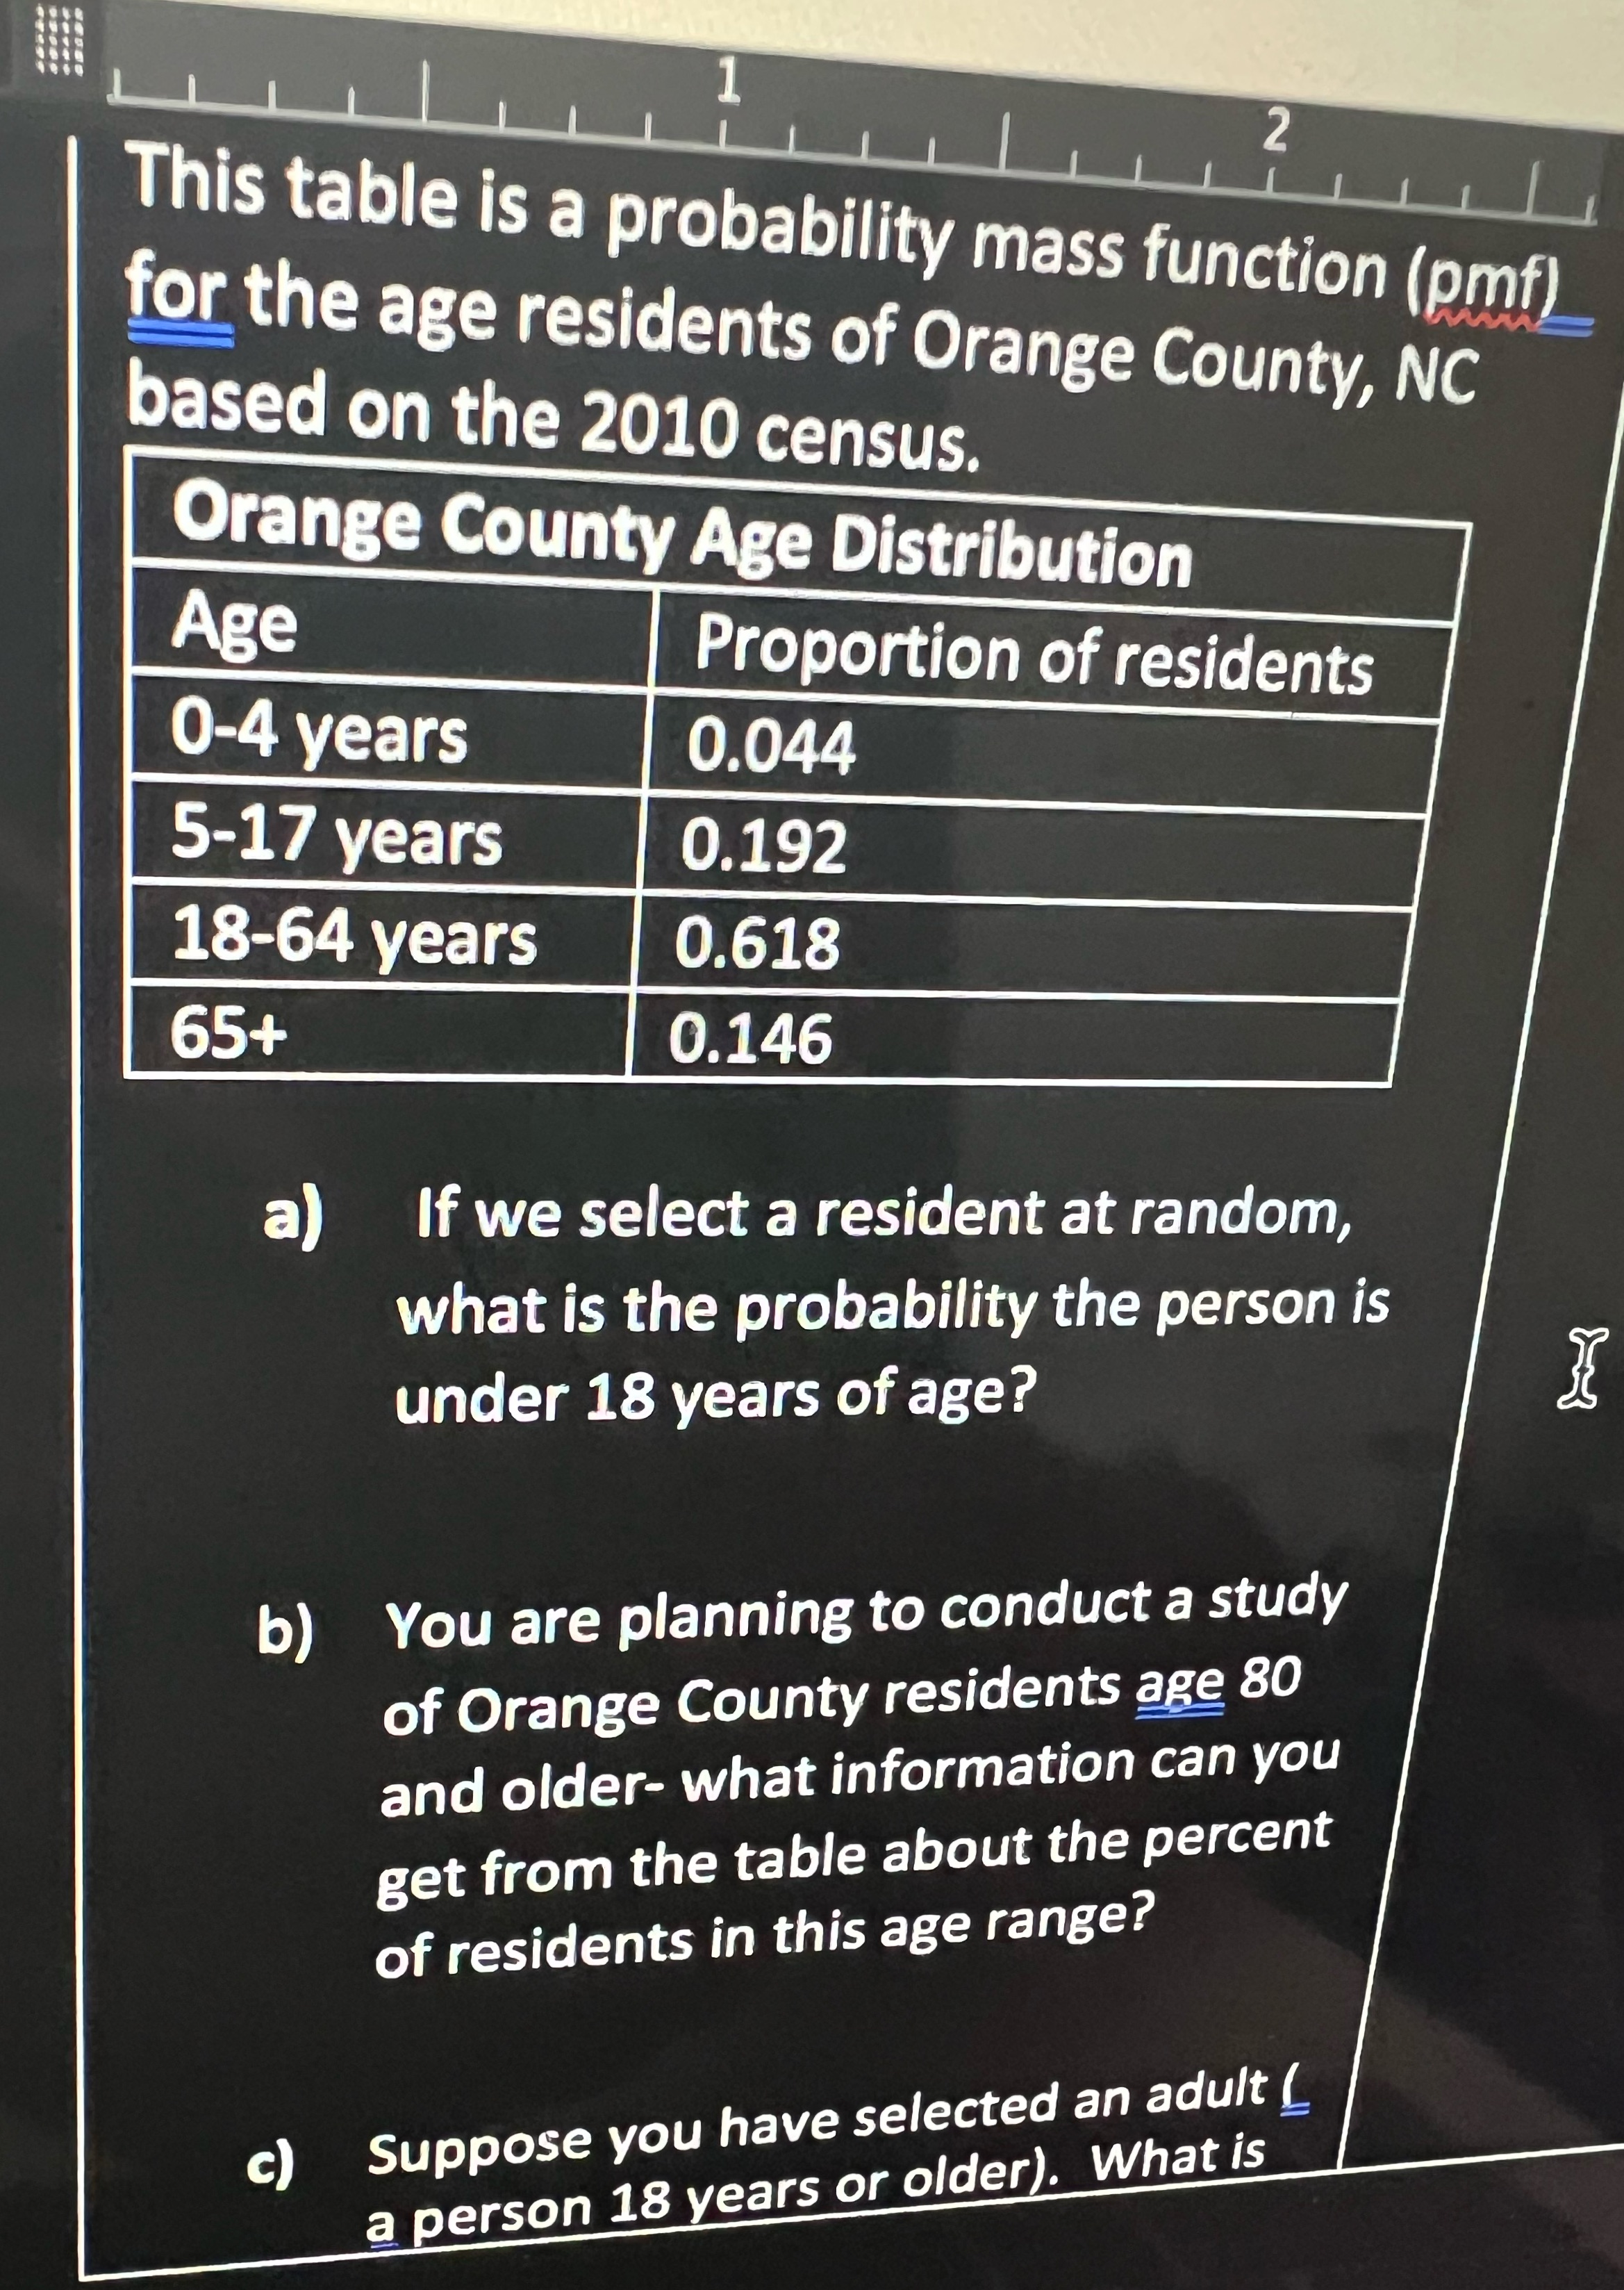
1 2 This table is a probability mass function (pmf) for the age residents of Orange County, NC based on the 2010 census. Orange County Age Distribution Age Proportion of residents 0-4 years 0.044 5-17 years 0.192 18-64 years 0.618 65+ 0.146 a) If we select a resident at random, c) b) what is the probability the person is under 18 years of age? You are planning to conduct a study of Orange County residents age 80 and older- what information can you get from the table about the percent of residents in this age range? Suppose you have selected an adult ( a person 18 years or older). What is I
Step by Step Solution
There are 3 Steps involved in it
Step: 1

Get step-by-step solutions from verified subject matter experts
100% Satisfaction Guaranteed-or Get a Refund!
Step: 2Unlock detailed examples and clear explanations to master concepts

Step: 3Unlock to practice, ask and learn with real-world examples
See step-by-step solutions with expert insights and AI powered tools for academic success
-
 Access 30 Million+ textbook solutions.
-
Ask unlimited questions from AI Tutors.
-
Order free textbooks.
-
100% Satisfaction Guaranteed-or Get a Refund!
Claim Your Hoodie Now!

Authors: Frederick R. Adler
3rd edition
840064187, 978-1285225975, 128522597X, 978-0840064189

Study Smart with AI Flashcards
Access a vast library of flashcards, create your own, and experience a game-changing transformation in how you learn and retain knowledge
Explore Flashcards

