Answered step by step
Verified Expert Solution
Question
1 Approved Answer
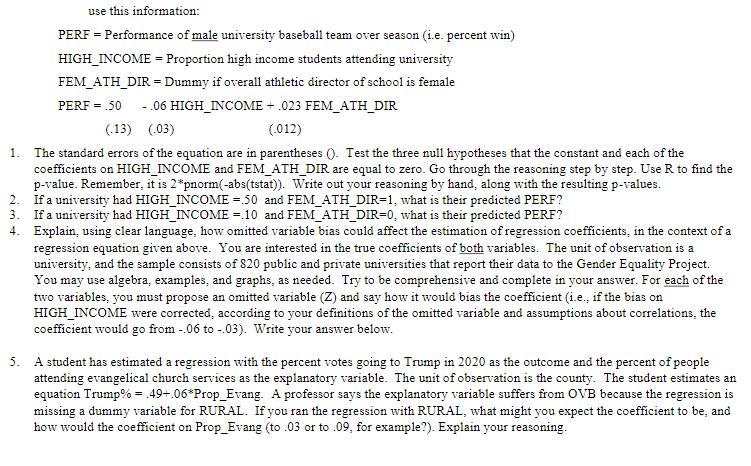
1. 2. use this information: PERF Performance of male university baseball team over season (i.e. percent win) HIGH_INCOME = Proportion high income students attending

1. 2. use this information: PERF Performance of male university baseball team over season (i.e. percent win) HIGH_INCOME = Proportion high income students attending university FEM_ATH_DIR= Dummy if overall athletic director of school is female PERF = .50 -.06 HIGH INCOME + .023 FEM_ATH_DIR (.13) (.03) (.012) The standard errors of the equation are in parentheses (). Test the three null hypotheses that the constant and each of the coefficients on HIGH INCOME and FEM ATH_DIR are equal to zero. Go through the reasoning step by step. Use R to find the p-value. Remember, it is 2*pnorm(-abs(tstat)). Write out your reasoning by hand, along with the resulting p-values. If a university had HIGH INCOME =50 and FEM_ATH_DIR=1, what is their predicted PERF? 3. If a university had HIGH INCOME =.10 and FEM_ATH_DIR=0, what is their predicted PERF? 4. Explain, using clear language, how omitted variable bias could affect the estimation of regression coefficients, in the context of a regression equation given above. You are interested in the true coefficients of both variables. The unit of observation is a university, and the sample consists of 820 public and private universities that report their data to the Gender Equality Project. You may use algebra, examples, and graphs, as needed. Try to be comprehensive and complete in your answer. For each of the two variables, you must propose an omitted variable (Z) and say how it would bias the coefficient (i.e., if the bias on HIGH_INCOME were corrected, according to your definitions of the omitted variable and assumptions about correlations, the coefficient would go from -.06 to -.03). Write your answer below. 5. A student has estimated a regression with the percent votes going to Trump in 2020 as the outcome and the percent of people attending evangelical church services as the explanatory variable. The unit of observation is the county. The student estimates an equation Trump% = .49+.06*Prop_Evang. A professor says the explanatory variable suffers from OVB because the regression is missing a dummy variable for RURAL. If you ran the regression with RURAL, what might you expect the coefficient to be, and how would the coefficient on Prop_Evang (to .03 or to .09, for example?). Explain your reasoning.
Step by Step Solution
There are 3 Steps involved in it
Step: 1

Get Instant Access to Expert-Tailored Solutions
See step-by-step solutions with expert insights and AI powered tools for academic success
Step: 2

Step: 3

Ace Your Homework with AI
Get the answers you need in no time with our AI-driven, step-by-step assistance
Get Started


