

Answered step by step
Verified Expert Solution
Question
1 Approved Answer
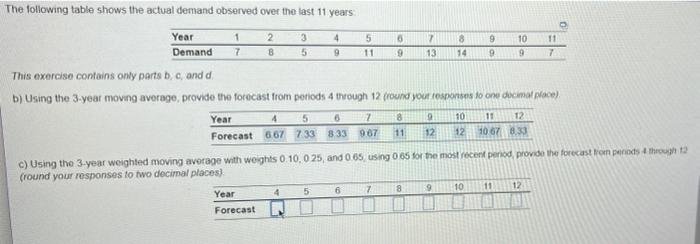
1 3 4 8 5 11 2 13 10 9 9 14 The following table shows the actual demand observed over the last 11 years
Step by Step Solution
There are 3 Steps involved in it
Step: 1

Get Instant Access to Expert-Tailored Solutions
See step-by-step solutions with expert insights and AI powered tools for academic success
Step: 2

Step: 3
Ace Your Homework with AI
Get the answers you need in no time with our AI-driven, step-by-step assistance
Get Started
Foreign Exchange Options An International Guide To Currency Options Trading And Practice
Authors: Alan Hicks
2nd Edition
185573253X,1845699017