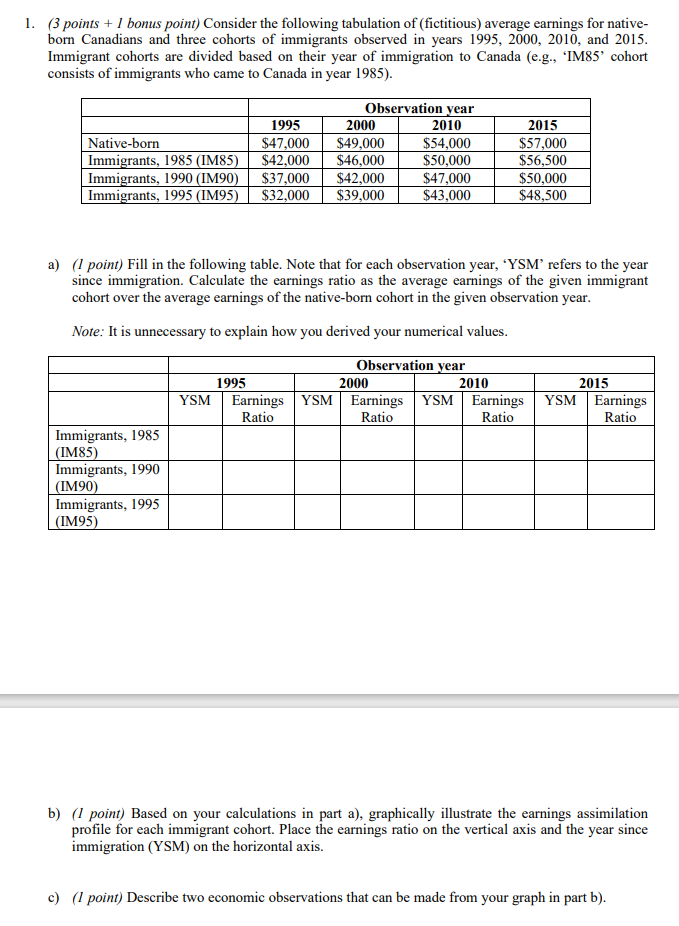
1. (3 points + 1 bonus point) Consider the following tabulation of (fictitious) average earnings for native- born Canadians and three cohorts of immigrants observed in years 1995, 2000, 2010, and 2015. Immigrant cohorts are divided based on their year of immigration to Canada (e.g., "IM85' cohort consists of immigrants who came to Canada in year 1985). Native-born Immigrants, 1985 (IM85) Immigrants, 1990 (IM90) Immigrants, 1995 (IM95) 1995 $47,000 $42,000 $37,000 $32,000 Observation year 2000 2010 $49,000 $54,000 $46,000 $50,000 $42,000 $47,000 $39,000 $43,000 2015 $57,000 $56,500 $50,000 $48,500 a) (1 point) Fill in the following table. Note that for each observation year, 'YSM' refers to the year since immigration. Calculate the earnings ratio as the average earnings of the given immigrant cohort over the average earnings of the native-born cohort in the given observation year. Note: It is unnecessary to explain how you derived your numerical values. Observation year 1995 2000 2010 YSM Earnings YSM Earnings YSM Earnings Ratio Ratio Ratio 2015 YSM Earnings Ratio Immigrants, 1985 (IM85) Immigrants, 1990 (IM90) Immigrants, 1995 (IM95) b) (1 point) Based on your calculations in part a), graphically illustrate the earnings assimilation profile for each immigrant cohort. Place the earnings ratio on the vertical axis and the year since immigration (YSM) on the horizontal axis. c) (1 point) Describe two economic observations that can be made from your graph in part b). 1. (3 points + 1 bonus point) Consider the following tabulation of (fictitious) average earnings for native- born Canadians and three cohorts of immigrants observed in years 1995, 2000, 2010, and 2015. Immigrant cohorts are divided based on their year of immigration to Canada (e.g., "IM85' cohort consists of immigrants who came to Canada in year 1985). Native-born Immigrants, 1985 (IM85) Immigrants, 1990 (IM90) Immigrants, 1995 (IM95) 1995 $47,000 $42,000 $37,000 $32,000 Observation year 2000 2010 $49,000 $54,000 $46,000 $50,000 $42,000 $47,000 $39,000 $43,000 2015 $57,000 $56,500 $50,000 $48,500 a) (1 point) Fill in the following table. Note that for each observation year, 'YSM' refers to the year since immigration. Calculate the earnings ratio as the average earnings of the given immigrant cohort over the average earnings of the native-born cohort in the given observation year. Note: It is unnecessary to explain how you derived your numerical values. Observation year 1995 2000 2010 YSM Earnings YSM Earnings YSM Earnings Ratio Ratio Ratio 2015 YSM Earnings Ratio Immigrants, 1985 (IM85) Immigrants, 1990 (IM90) Immigrants, 1995 (IM95) b) (1 point) Based on your calculations in part a), graphically illustrate the earnings assimilation profile for each immigrant cohort. Place the earnings ratio on the vertical axis and the year since immigration (YSM) on the horizontal axis. c) (1 point) Describe two economic observations that can be made from your graph in part b)