

Answered step by step
Verified Expert Solution
Question
1 Approved Answer
1. (3 pts.) What is the relation between investment horizon (i.e. the time you would expect to hold an investment in your portfolio) and the
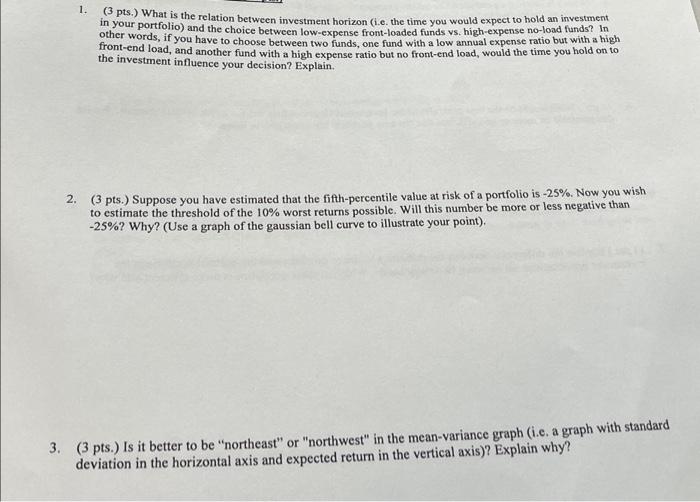
1. (3 pts.) What is the relation between investment horizon (i.e. the time you would expect to hold an investment in your portfolio) and the choice between low-expense front-loaded funds vs. high-expense no-load funds? In other words, if you have to choose between two funds, one fund with a low annual expense ratio but with a high front-end load, and another fund with a high expense ratio but no front-end load, would the time you hold on to the investment influence your decision? Explain. 2. (3 pts.) Suppose you have estimated that the fifth-percentile value at risk of a portfolio is -25%. Now you wish to estimate the threshold of the 10% worst returns possible. Will this number be more or less negative than -25%? Why? (Use a graph of the gaussian bell curve to illustrate your point). 3. (3 pts.) Is it better to be "northeast" or "northwest" in the mean-variance graph (i.e. a graph with standard deviation in the horizontal axis and expected return in the vertical axis)? Explain why?
Step by Step Solution
There are 3 Steps involved in it
Step: 1

Get Instant Access to Expert-Tailored Solutions
See step-by-step solutions with expert insights and AI powered tools for academic success
Step: 2

Step: 3
Ace Your Homework with AI
Get the answers you need in no time with our AI-driven, step-by-step assistance
Get Started
The Palgrave International Handbook Of Basic Income
Authors: Malcolm Torry
1st Edition
3030236137, 978-3030236137