1 $383 Freq uency (Court! 9) 8 1O 0 100 2m 300 Number of {305 Source: httpstlfonlinecourses.science.psu.edu/ The graph shown above is an example of
1
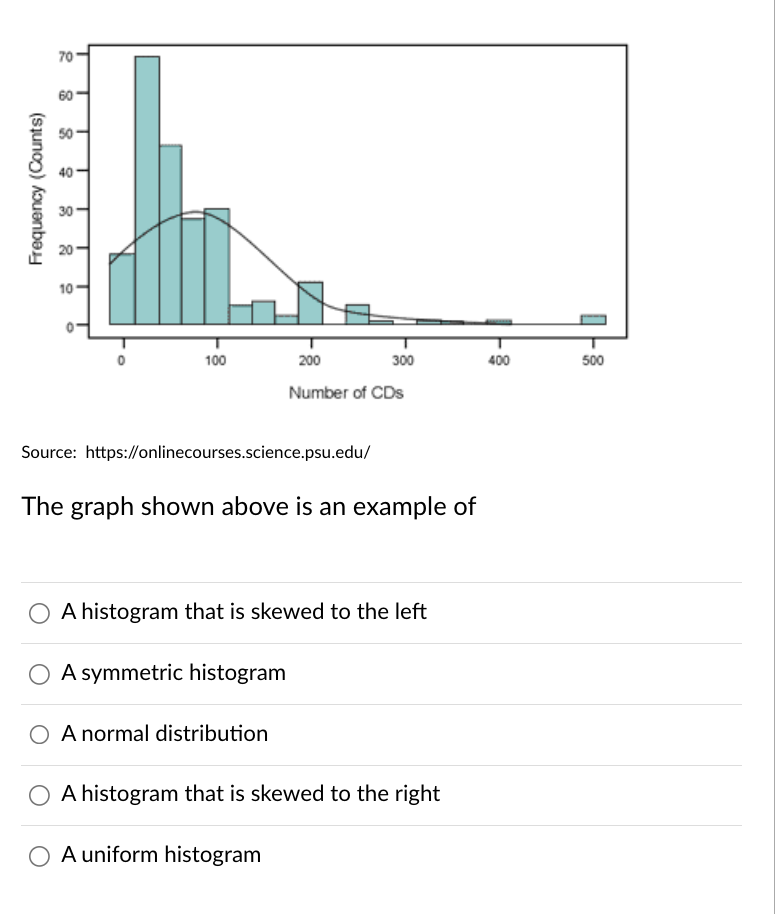
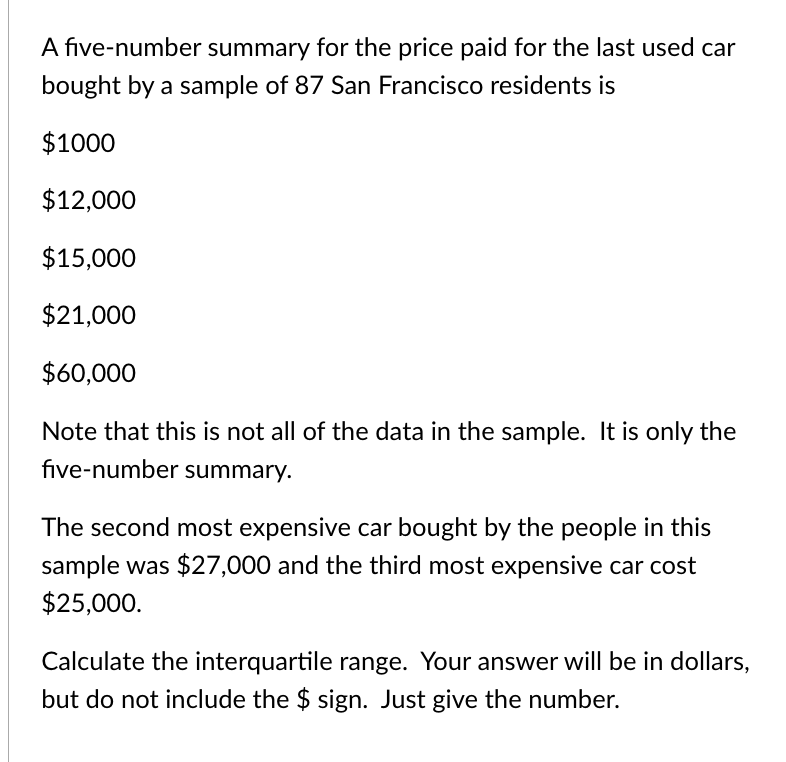
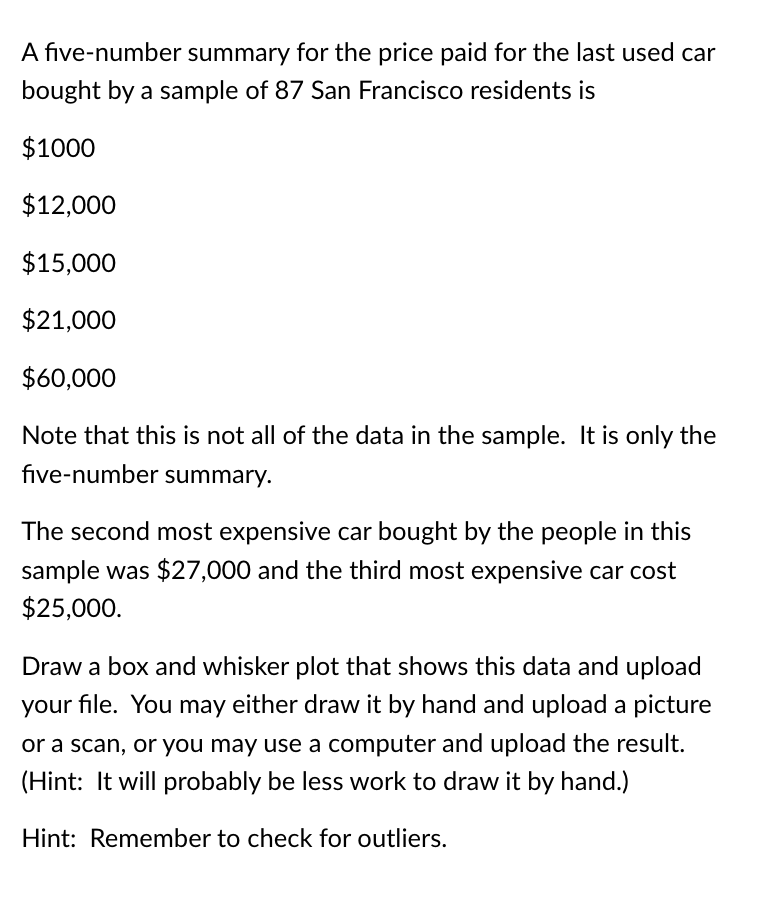
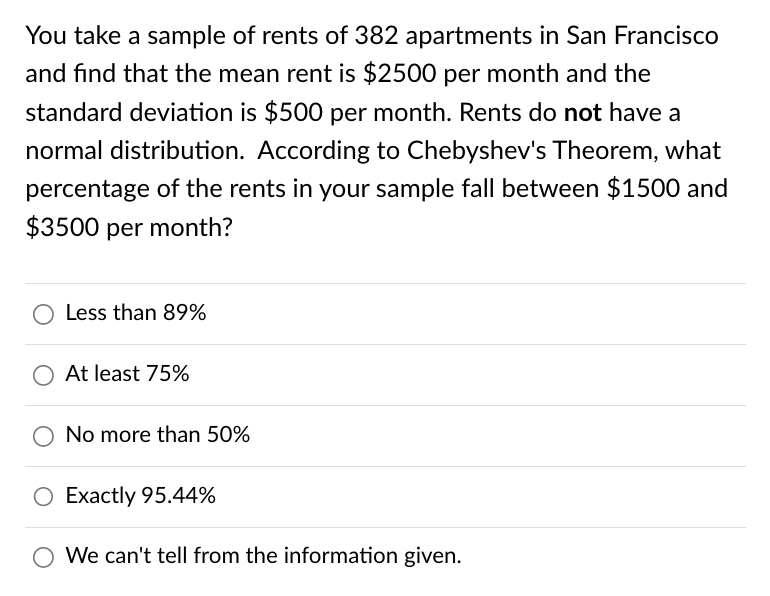
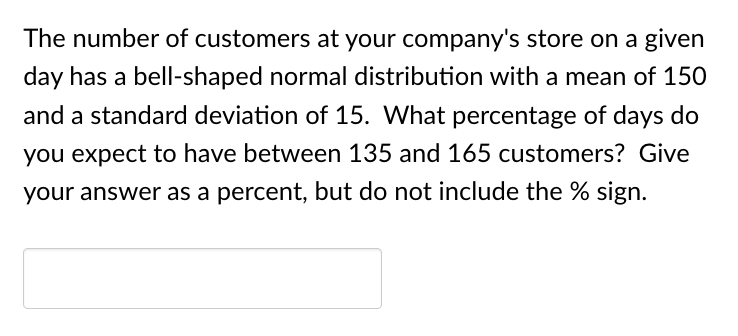
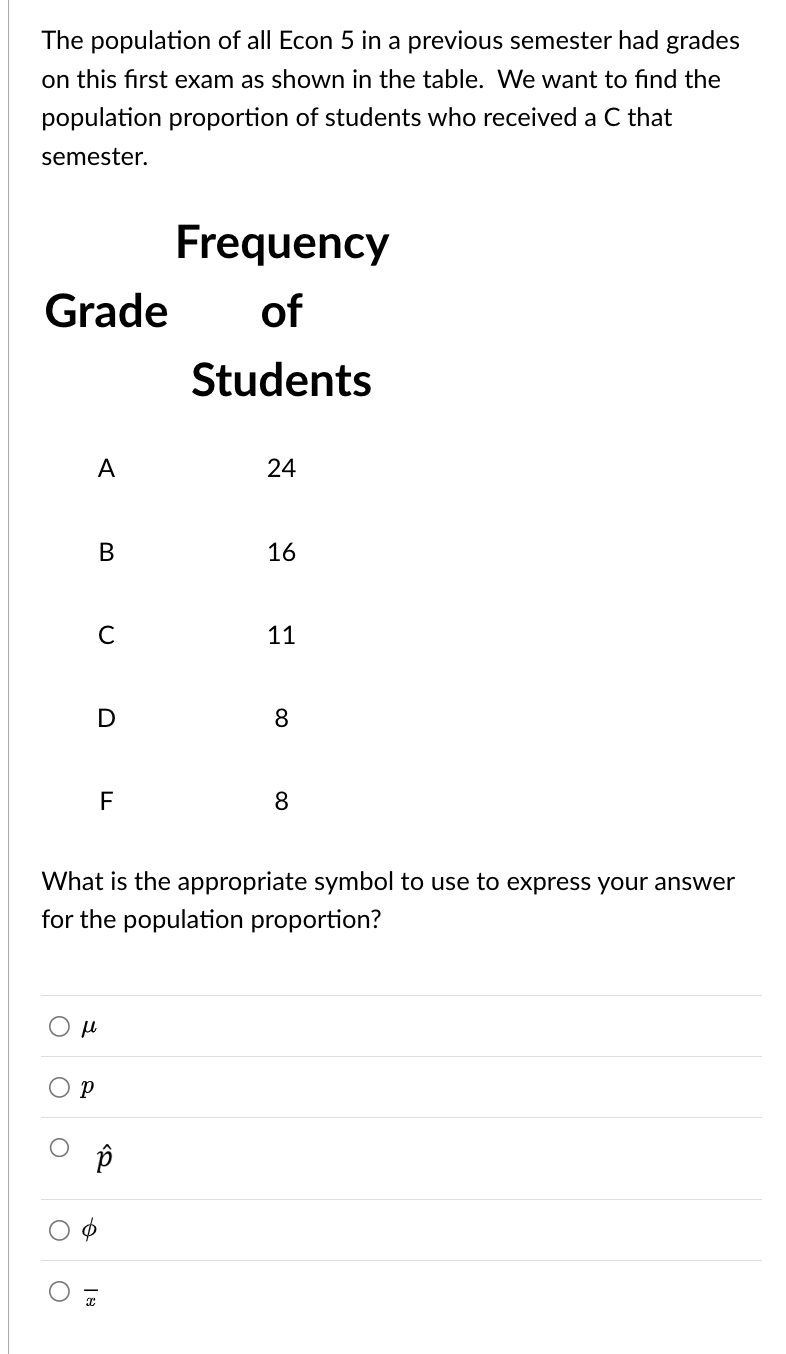
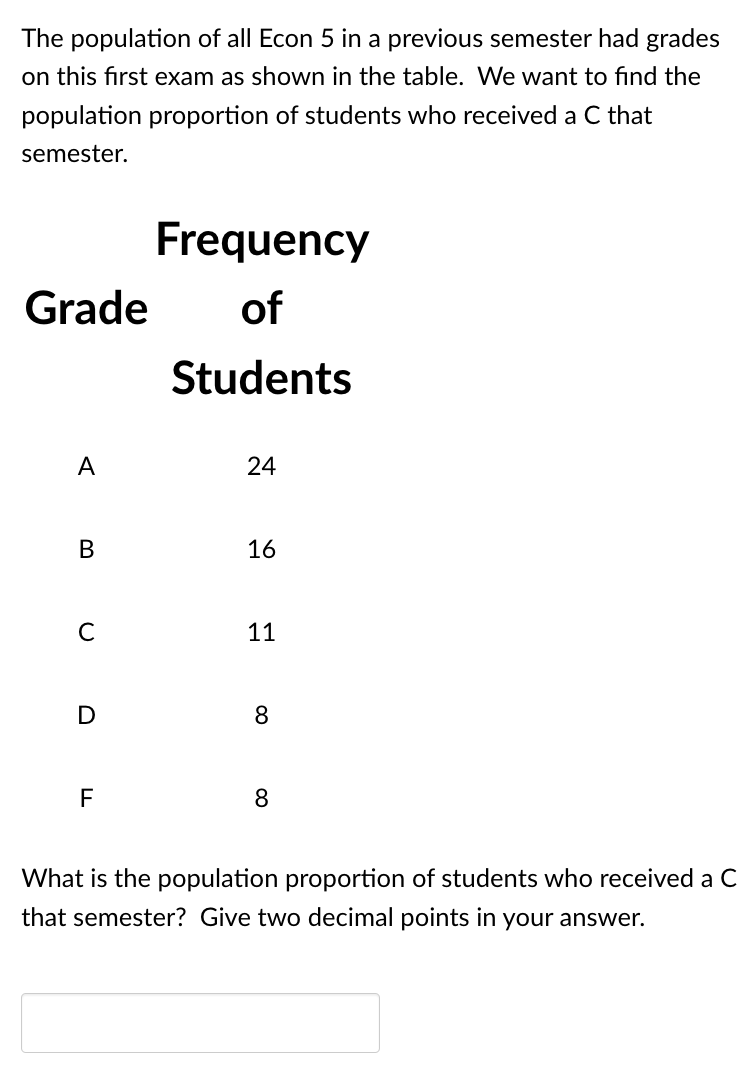
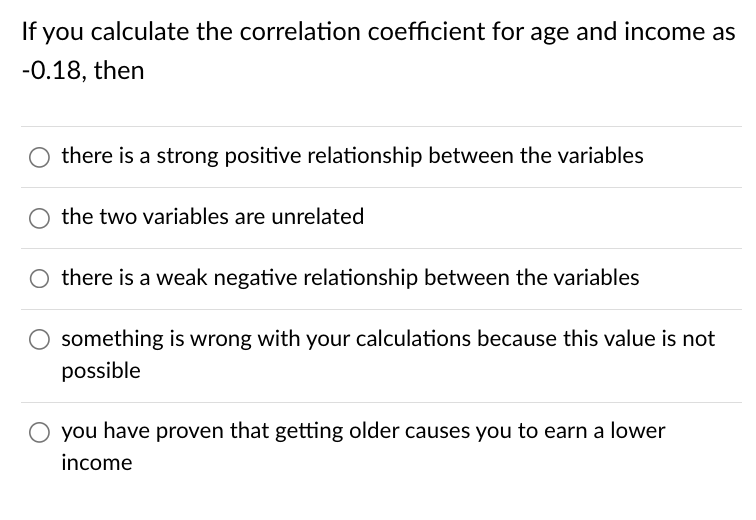
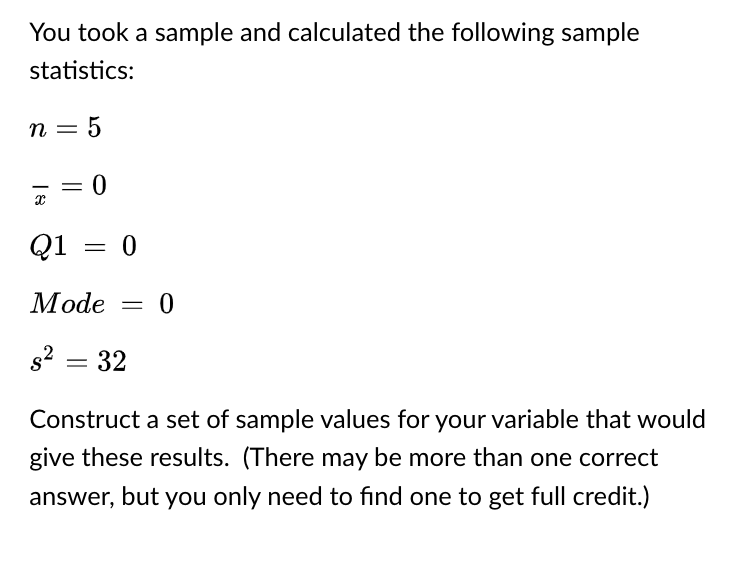
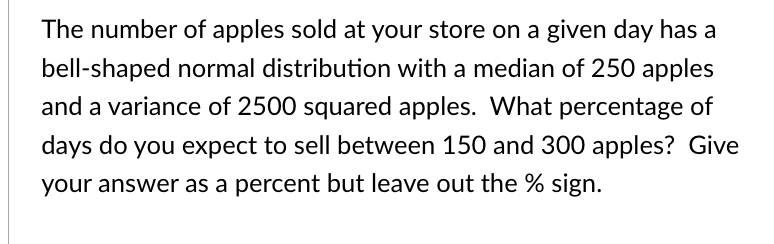
$383 Freq uency (Court! 9) 8 1O 0 100 2m 300 Number of {305 Source: httpstlfonlinecourses.science.psu.edu/ The graph shown above is an example of Q A histogram that is skewed to the left Q A symmetric histogram O A normal distribution 0 A histogram that is skewed to the right 0 A uniform histogram I'M A ve-number summary for the price paid for the last used car bought by a sample of 87 San Francisco residents is $1000 $12,000 $15,000 $21,000 $60,000 Note that this is not all of the data in the sample. It is only the ve-number summary. The second most expensive car bought by the people in this sample was $27,000 and the third most expensive car cost $25,000. Calculate the interquartile range. Your answer will be in dollars, but do not include the 55 sign. Just give the number. A ve-number summary for the price paid for the last used car bought by a sample of 87 San Francisco residents is $1000 $12,000 $15,000 $21,000 $60,000 Note that this is not all of the data in the sample. It is only the ve-number summary. The second most expensive car bought by the people in this sample was $27,000 and the third most expensive car cost $25,000. Draw a box and whisker plot that shows this data and upload your le. You may either draw it by hand and upload a picture or a scan, or you may use a computer and upload the result. (Hint: It will probably be less work to draw it by hand.) Hint: Remember to check for outliers. You take a sample of rents of 382 apartments in San Francisco and nd that the mean rent is $2500 per month and the standard deviation is $500 per month. Rents do not have a normal distribution. According to Chebyshev's Theorem, what percentage of the rents in your sample fall between $1500 and $3500 per month? 0 Less than 89% Q At least 75% O No more than 50% O Exactly 95.44% Q We can't tell from the information given. The number of customers at your company's store on a given day has a bell-shaped normal distribution with a mean of 150 and a standard deviation of 15. What percentage of days do you expect to have between 135 and 165 customers? Give your answer as a percent, but do not include the % sign. The population of all Econ 5 in a previous semester had grades on this first exam as shown in the table. We want to find the population proportion of students who received a C that semester. Frequency Grade of Students A 24 B 16 C 11 D 8 F 8 What is the appropriate symbol to use to express your answer for the population proportion? OP O p O TThe population of all Econ 5 in a previous semester had grades on this first exam as shown in the table. We want to find the population proportion of students who received a C that semester. Frequency Grade of Students A 24 B 16 C 11 D 8 F 8 What is the population proportion of students who received a C that semester? Give two decimal points in your answer.In DeShawn's statistics class there were three exams. The first was worth 20% of the course grade and DeShawn scored 90. The second was worth 30% and DeShawn scored 100. The third was worth 50% and DeShawn scored 80. What was the weighted mean of DeShawn's exam scores for his course grade?If you calculate the correlation coefficient for age and income as -0.18, then O there is a strong positive relationship between the variables O the two variables are unrelated O there is a weak negative relationship between the variables O something is wrong with your calculations because this value is not possible O you have proven that getting older causes you to earn a lower incomeYou took a sample and calculated the following sample statistics: n=5 5:0 621:0 Mode=0 32:32 Construct a set of sample values for your variable that would give these results. (There may be more than one correct answer, but you only need to nd one to get full credit.) The number of apples sold at your store on a given day has a bell-shaped normal distribution with a median of 250 apples and a variance of 2500 squared apples. What percentage of days do you expect to sell between 150 and 300 apples? Give your answer as a percent but leave out the % sign
Step by Step Solution
There are 3 Steps involved in it
Step: 1
Get Instant Access to Expert-Tailored Solutions
See step-by-step solutions with expert insights and AI powered tools for academic success
Step: 2
Step: 3
Ace Your Homework with AI
Get the answers you need in no time with our AI-driven, step-by-step assistance