Question
1. (4 points) Using the following chart, find the mean, variance, and standard deviation. One point per each correct answer and one point for

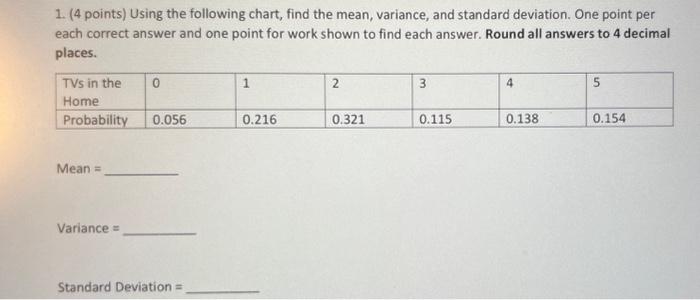
1. (4 points) Using the following chart, find the mean, variance, and standard deviation. One point per each correct answer and one point for work shown to find each answer. Round all answers to 4 decimal places. TVs in the Home Probability Mean = Variance = 0 0.056 Standard Deviation = 1 0.216 2 0.321 3 0.115 4 0.138 5 0.154
Step by Step Solution
3.33 Rating (153 Votes )
There are 3 Steps involved in it
Step: 1

Get Instant Access to Expert-Tailored Solutions
See step-by-step solutions with expert insights and AI powered tools for academic success
Step: 2

Step: 3

Ace Your Homework with AI
Get the answers you need in no time with our AI-driven, step-by-step assistance
Get StartedRecommended Textbook for
Introductory Statistics
Authors: Prem S. Mann
8th Edition
9781118473986, 470904100, 1118473981, 978-0470904107
Students also viewed these Accounting questions
Question
Answered: 1 week ago
Question
Answered: 1 week ago
Question
Answered: 1 week ago
Question
Answered: 1 week ago
Question
Answered: 1 week ago
Question
Answered: 1 week ago
Question
Answered: 1 week ago
Question
Answered: 1 week ago
Question
Answered: 1 week ago
Question
Answered: 1 week ago
Question
Answered: 1 week ago
Question
Answered: 1 week ago
Question
Answered: 1 week ago
Question
Answered: 1 week ago
Question
Answered: 1 week ago
Question
Answered: 1 week ago
Question
Answered: 1 week ago
Question
Answered: 1 week ago
Question
Answered: 1 week ago
Question
Answered: 1 week ago
Question
Answered: 1 week ago
Question
Answered: 1 week ago
View Answer in SolutionInn App


