Answered step by step
Verified Expert Solution
Question
1 Approved Answer
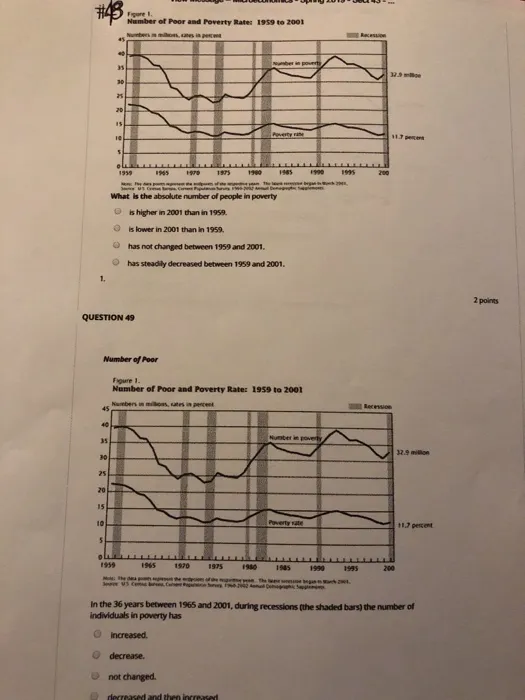
1. 45 40 35 30 25 20 15 45 10 40 35 QUESTION 49 5 Plu 30 25 20 15 10 S o Figure

1. 45 40 35 30 25 20 15 45 10 40 35 QUESTION 49 5 Plu 30 25 20 15 10 S o Figure 1. Number of Poor and Poverty Rate: 1959 to 2001 Numbers caesi percent 1959 # Number of Poor Figure 1. Number of Poor and Poverty Rate: 1959 to 2001 Numbers in mios, cates in percent 1965 1975 1965 1970 Me: The de pressepresent JUS Ce Put Deng What is the absolute number of people in poverty is higher in 2001 than in 1959. is lower in 2001 than in 1959. has not changed between 1959 and 2001. has steadily decreased between 1959 and 2001. 1900 1975 Number in poverty, not changed. decreased and then increased Poverty rate 1950 LLLLLLLL 1990 1985 Number in poverty Poverty rate 1995 2, 1905 1990 gree began 201 1995 Recession 2:00 32.9 11.7 percent Recession 200 32.9 million 11.7 percent In the 36 years between 1965 and 2001, during recessions (the shaded bars) the number of individuals in poverty has Increased. decrease. 2 points
Step by Step Solution
There are 3 Steps involved in it
Step: 1
Based on the given information and the graph provide...
Get Instant Access to Expert-Tailored Solutions
See step-by-step solutions with expert insights and AI powered tools for academic success
Step: 2

Step: 3

Ace Your Homework with AI
Get the answers you need in no time with our AI-driven, step-by-step assistance
Get Started


