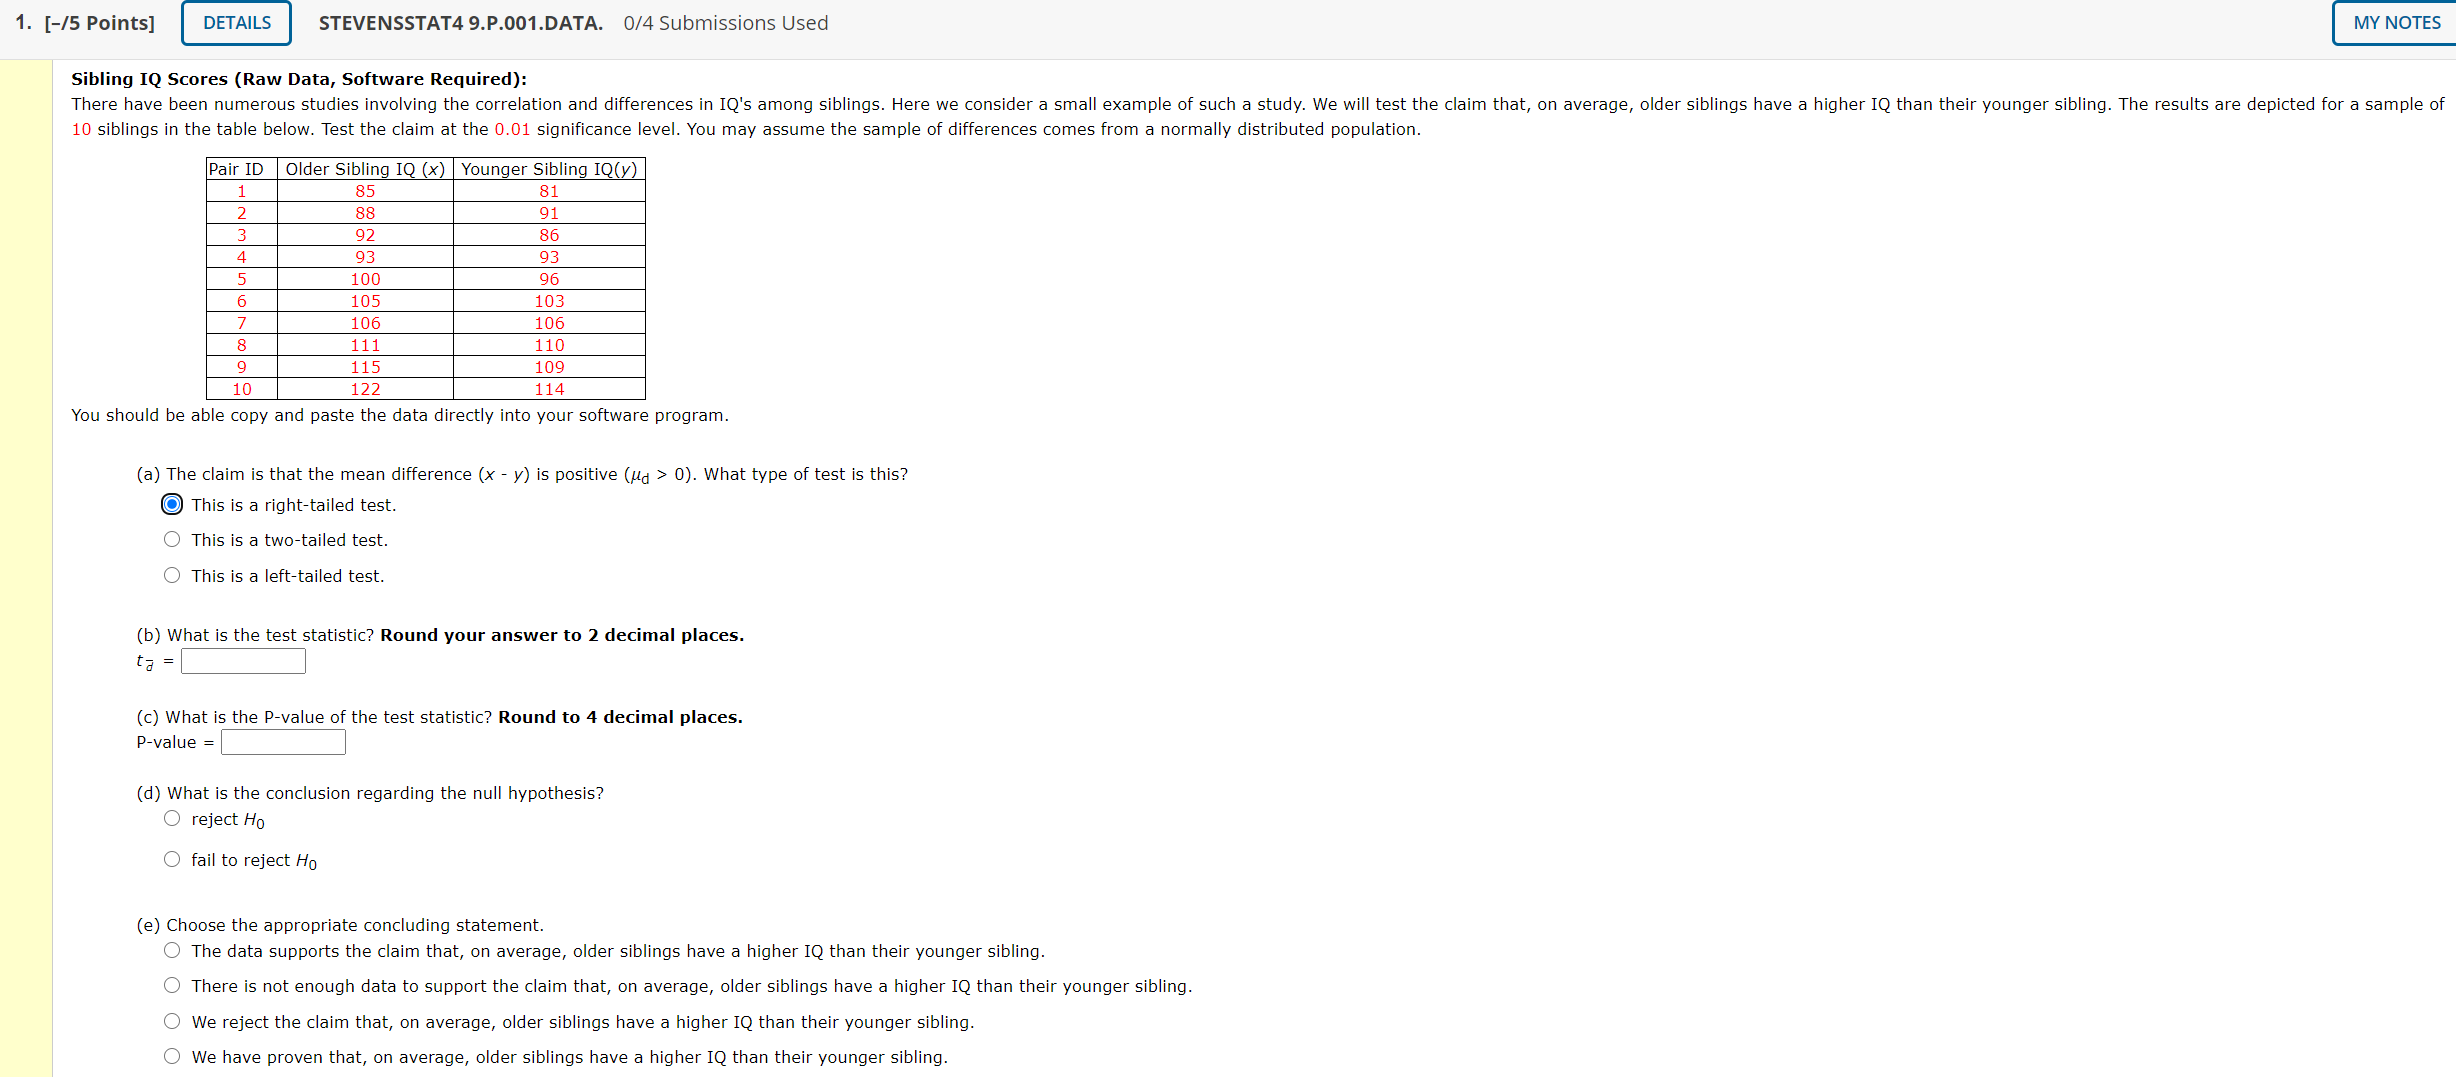
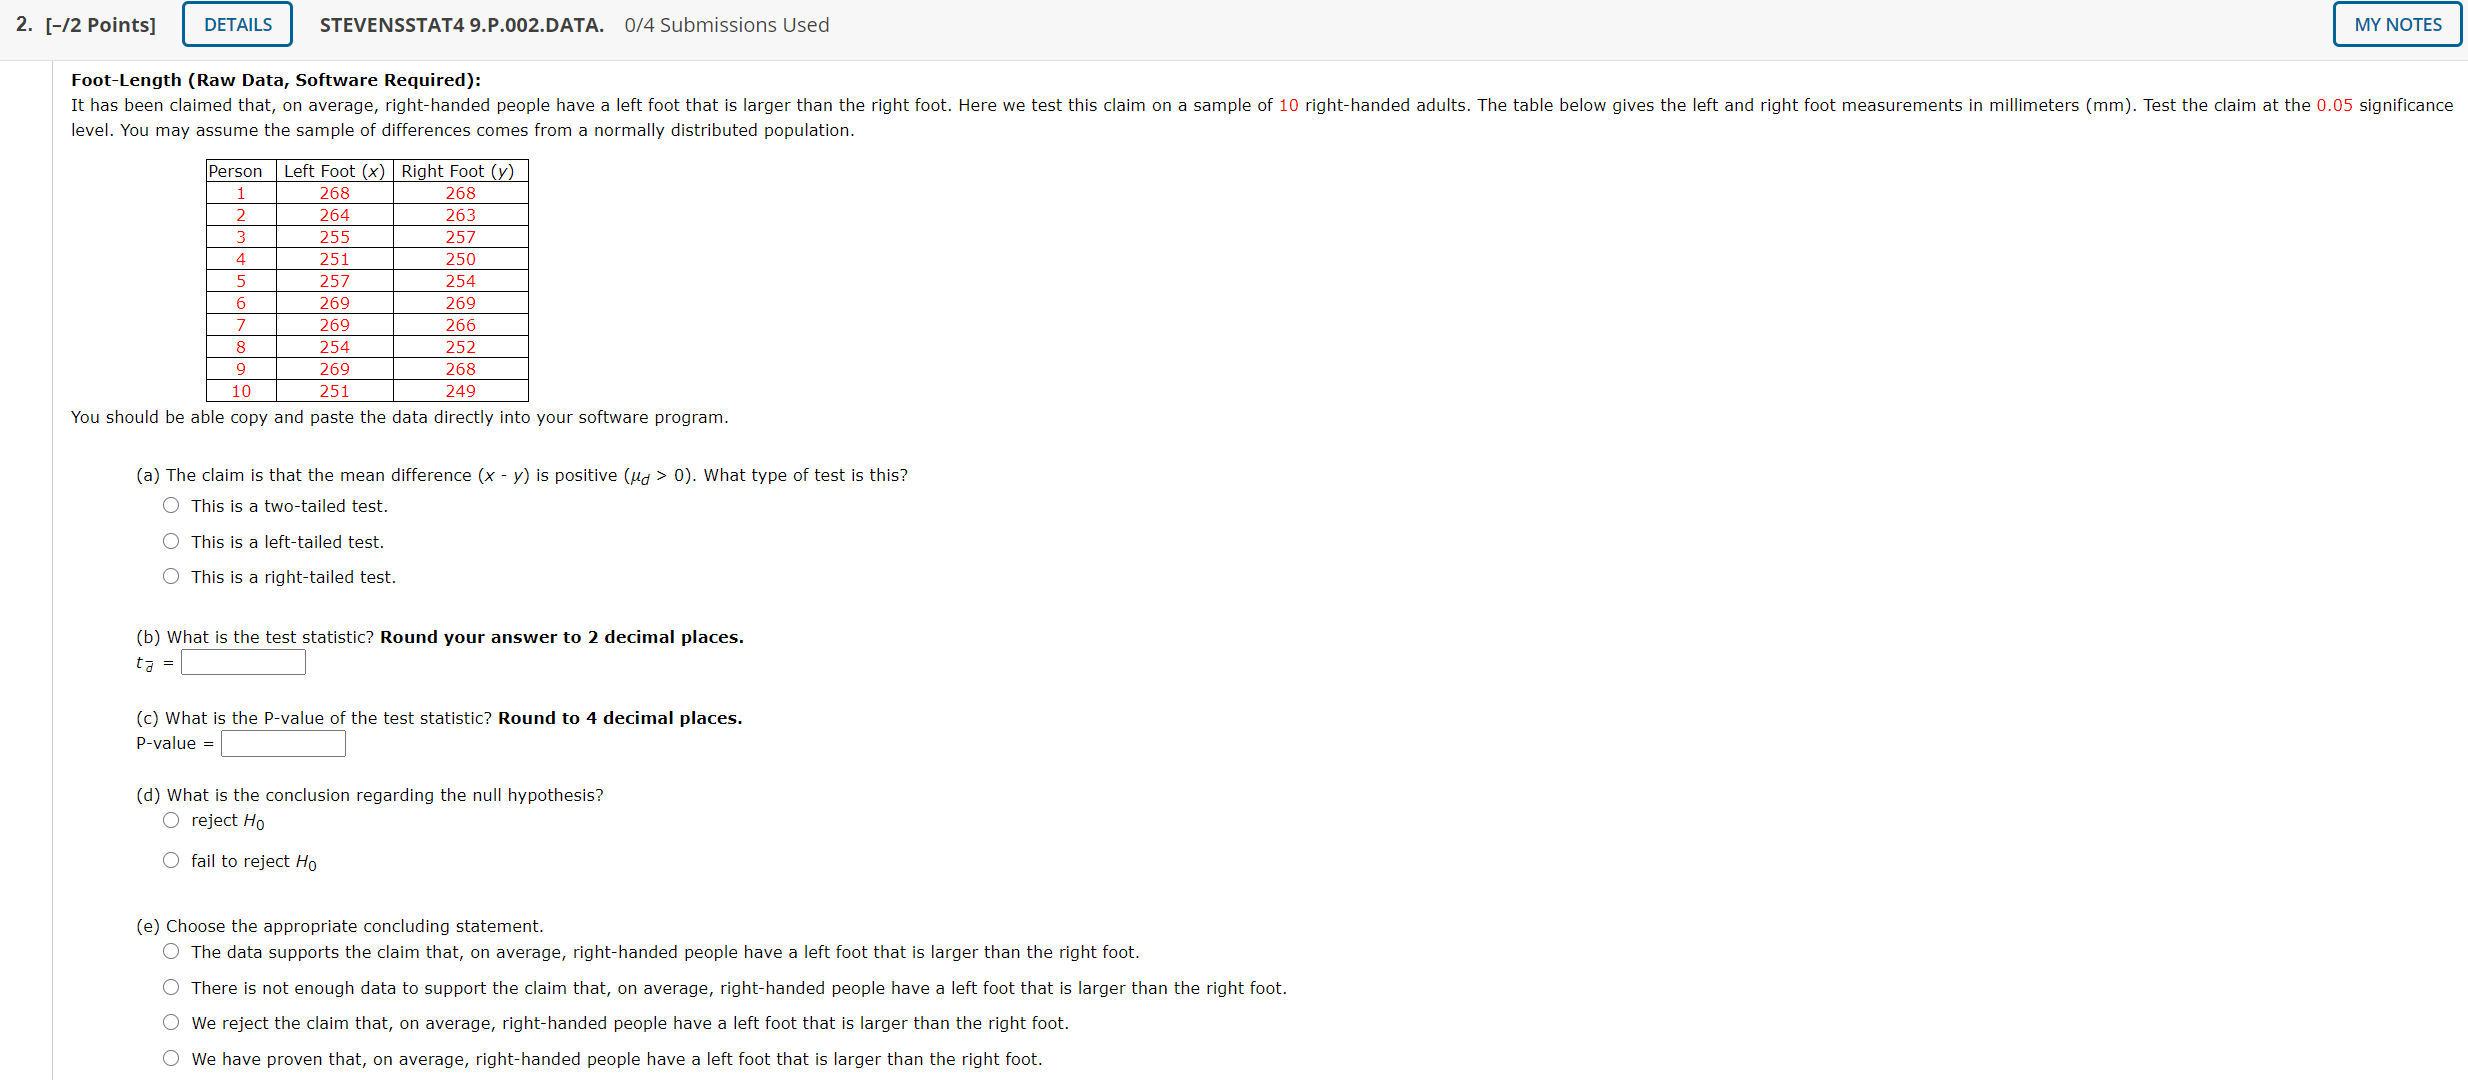
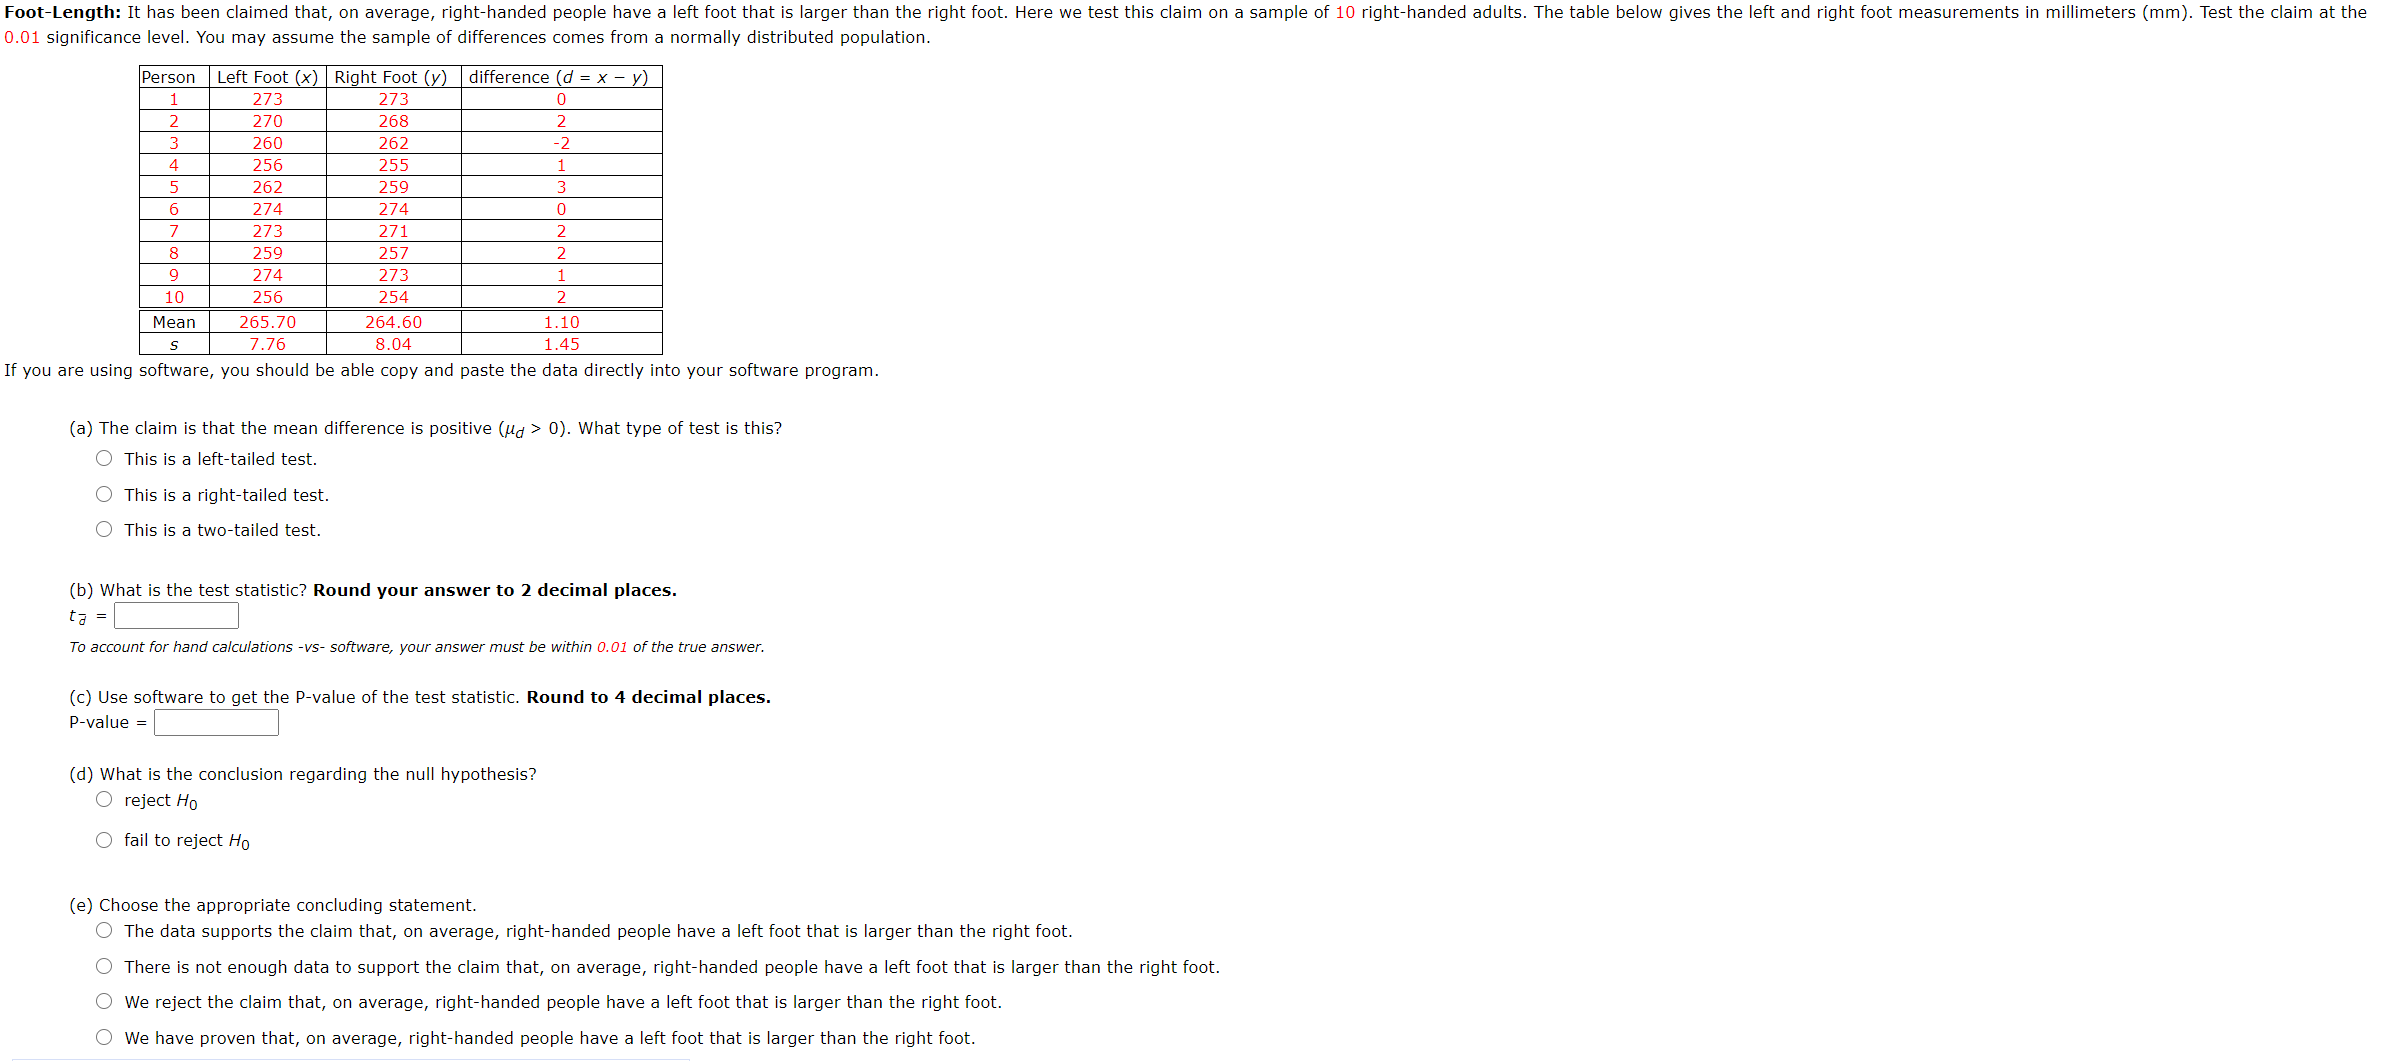
1. [-/5 Points] STEVENSSTAT4 9.P.001.DATA. 0/4 Submissions Used Sibling IQ Scores (Raw Data, Software Required): There have been numerous studies involving the correlation and differences in [Q's among siblings. Here we consider a small example of such a study. We will test the clalrn that, on average, older slbllngs have a higher 1Q than their younger sibling. The results are depicted for a sample of 10 siblings in the table below. Test the Claim at the 0.01 signicance level, You may assume the Sample of differences Comes from a normally distributed Population. Pair ID older Sibling IQ (x) Younger Sibling 1m 1 as 31 2 as 91 3 92 so A 93 93 5 100 96 6 105 103 7 106 105 8 111 110 9 115 109 10 122 114 You should be able copy and paste the data directly Into your software program. (a) The claim is that the mean difference (x , y) is positive (rid > u). what type of test Is this? @ This is a right-tailed test. 0 This is a two-tailed test. 0 Thls is a left-tailed test. (b) What is the test statlstici Round your answer to 2 decimal places. : (c) What Is the Pcvalue of the test statistic? Round to 4 decimal places. (d) what is the conclusion regarding the null hypothesis? 0 reject Ho r3: O fail to reject Ha (e) Choose the appropriate concluding statement. 0 The data supports the claim that, on average, older siblings have a higher IQ than their younger sibling. C) There is not enough data to support the claim that, on average, older siblings have a higher IQ than their Younger sibling. Q We rejeLt the claim that, on average, older siblings have a higher IQ than their younger sibling. 0 We have proven that, on average, older siblings have a higher IQ than their younger sibling. MY NOTES 2. [I2 Paints] STEVENSSTAT4 9.P.002.DATA. 0/4 Submissions Used FooHength (Raw Data, Software Required): It has been claimed that, on average, right-handed people have a left foot that is larger than the right foot. Here we test this claim on a sample of 10 right-handed aduls. The table below gives the let and right foot measurements in millimeters (mm). Test the claim at the 0.05 significance level. You may assume the sample or dlfferences comes from a normally distributed population. Person Left Foot (x) Right Foot (y) 1 265 26s 2 264 263 3 255 257 4 251 250 5 257 254 6 269 269 7 269 266 8 254 252 9 269 268 10 251 249 You should be able copy and paste the data directly into your software program. (a) The claim is that the mean difference (x - y) is positive (pd > 0). what type of test is this? 0 This is a twotailed test. 0 This is a left-tailed test. 0 This is a rlghtrtalled test. (b) what is the test statisticT Round your answer to 2 decimal places. t3= (c) what is the Pavalue of the test statistic? Round to 4 decimal places. (d) What is the conclusion regarding the null hypothesis? 0 reject Hu 0 fall to reject l-la (e) Choose the appropriate concluding statement. 0 The data supports the claim that, on average, right-handed people have a left foot that is larger than the right foot. 0 There is not enough data to support the claim that, on average, right-handed people have a left foot that is larger than the right foot. 0 We reject the claim that, on average, right-handed people have a left root that Is larger than the right foot. 0 We have Drove" that, on average, rightrhanded people have a left foot that is larger than the right foot. FootLength: It has been claimed that, on average, right-handed people have a left foot that is larger than the right foot. Here we test this claim on a sample of 10 right-handed adults. The table below gives the left and right foot measurements in millimeters (mm). Test the clalm at the cm significance level. You may assume the sample of differences comes from a normally distributed population, Person Left Foot (x) Right Foot (y) difference (d = x y) 1 273 273 o 2 270 268 2 3 260 252 72 4 256 255 1 5 262 259 3 o 274 274 o 7 273 271 2 E 259 257 2 9 274 273 1 10 256 254 2 Mean 255.70 264 60 1.10 s 7.76 8.04 1,45 If you are using software, you should be able copy and paste the data directly Into your software program. (a) The claim is that the mean difference is positive (pa > 0). what type of test is this7 O This is a ieftrtailed test. 0 This is a rightrtailed test. 0 This is a two-taed test. (b) What is the test statistic? Round your answer to 2 decimal places. t3 = To account for hand calculations -vs- software, your answer must be wirnin 0.01 of the we answer. (c) Use software to get the P-value of the test statistic. Round to 4 decimal places. P-value = (d) What is the conclusion regarding the null hypothesis? 0 reject HCl 0 fail to reject Hg (e) Choose the appropriate concluding statement 0 The data supports the claim that, on avemge, rightrhanded people have a left foot that is larger than the right foot. 0 There is not enough data to support the claim that, on average, righthanded people have a left foot that is larger than the right foot. 0 we reject the claim that, on average, right-handed people have a left foot that is larger than the right foot, 0 We have proven that, on average, right-handed people have a leit foot that is larger than the right foot. Retaking the SAT: Many high school students take the SAT's twice; once in their Junior year and once in their Senior year. In a sample of 40 such students, the score on the second try was, on average, 35 points above the first try with a standard deviation of 13 points. Test the claim that retaking the SAT increases the score on average by more than 30 points. Test this claim at the 0.10 significance level. (a) The claim is that the mean difference is greater than 30 (ud > 30), what type of test is this? O This is a left-tailed test. O This is a two-tailed test. O This is a right-tailed test. (b) What is the test statistic? Round your answer to 2 decimal places. ta = (c) Use software to get the P-value of the test statistic. Round to 4 decimal places. P-value = (d) What is the conclusion regarding the null hypothesis? O reject Ho O fail to reject Ho (e) Choose the appropriate concluding statement. The data supports the claim that retaking the SAT increases the score on average by more than 30 points. There is not enough data to support the claim that retaking the SAT increases the score on average by more than 30 points. We reject the claim that retaking the SAT increases the score on average by more than 30 points. We have proven that retaking the SAT increases the score on average by more than 30 points. Additional Materials eBook


