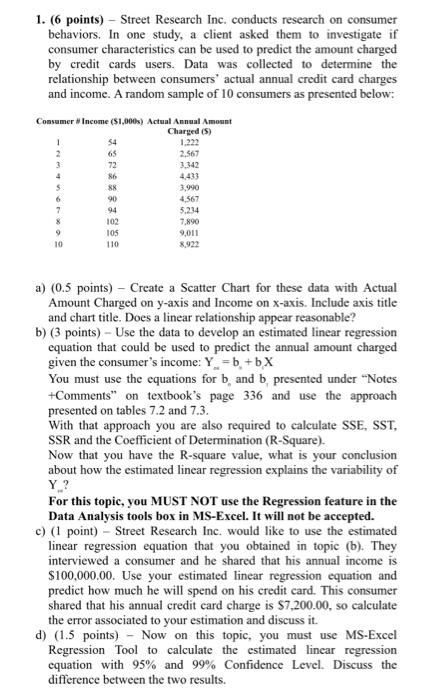
1. (6 points) - Street Research Inc, conducts research on consumer behaviors. In one study, a client asked them to investigate if consumer characteristics can be used to predict the amount charged by credit cards users. Data was collected to determine the relationship between consumers' actual annual credit card charges and income. A random sample of 10 consumers as presented below: a) ( 0.5 points) - Create a Scatter Chart for these data with Actual Amount Charged on y-axis and Income on x-axis. Include axis title and chart title. Does a linear relationship appear reasonable? b) (3 points) - Use the data to develop an estimated linear regression equation that could be used to predict the annual amount charged given the consumer's income: Ye=bs+blX You must use the equations for bn and b, presented under "Notes +Comments" on textbook's page 336 and use the approach presented on tables 7.2 and 7.3. With that approach you are also required to calculate SSE, SST, SSR and the Coefficient of Determination (R-Square). Now that you have the R-square value, what is your conclusion about how the estimated linear regression explains the variability of Yw ? For this topic, you MUST NOT use the Regression feature in the Data Analysis tools box in MS-Excel. It will not be accepted. c) (1 point) - Street Research Inc. would like to use the estimated linear regression equation that you obtained in topic (b). They interviewed a consumer and he shared that his annual income is $100,000.00. Use your estimated linear regression equation and predict how much he will spend on his credit card. This consumer shared that his annual credit card charge is $7,200.00, so calculate the error associated to your estimation and discuss it. d) (1.5 points) - Now on this topic, you must use MS-Excel Regression Tool to calculate the estimated linear regression equation with 95% and 99% Confidence Level. Discuss the difference between the two results