Answered step by step
Verified Expert Solution
Question
1 Approved Answer
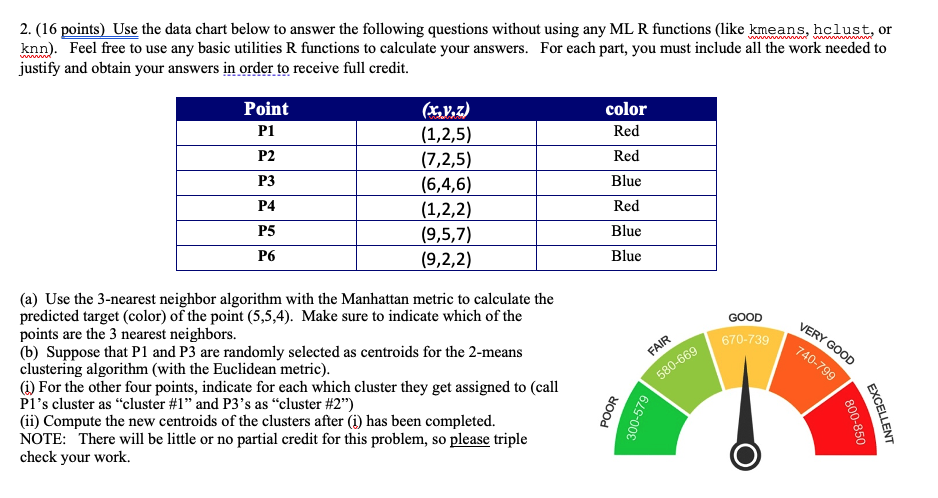
( 1 6 points ) Use the data chart below to answer the following questions without using any ML R functions ( like kmeans, hclust,
points Use the data chart below to answer the following questions without using any ML R functions like kmeans, hclust, or
Feel free to use any basic utilities functions to calculate your answers. For each part, you must include all the work needed to
justify and obtain your answers in order to receive full credit.
a Use the nearest neighbor algorithm with the Manhattan metric to calculate the
predicted target color of the point Make sure to indicate which of the
points are the nearest neighbors.
b Suppose that P and P are randomly selected as centroids for the means
clustering algorithm with the Euclidean metric
i For the other four points, indicate for each which cluster they get assigned to call
Ps cluster as "cluster # and Ps as "cluster #
ii Compute the new centroids of the clusters after i has been completed.
NOTE: There will be little or no partial credit for this problem, so please triple
check your work.

Step by Step Solution
There are 3 Steps involved in it
Step: 1

Get Instant Access to Expert-Tailored Solutions
See step-by-step solutions with expert insights and AI powered tools for academic success
Step: 2

Step: 3

Ace Your Homework with AI
Get the answers you need in no time with our AI-driven, step-by-step assistance
Get Started


