Answered step by step
Verified Expert Solution
Question
1 Approved Answer
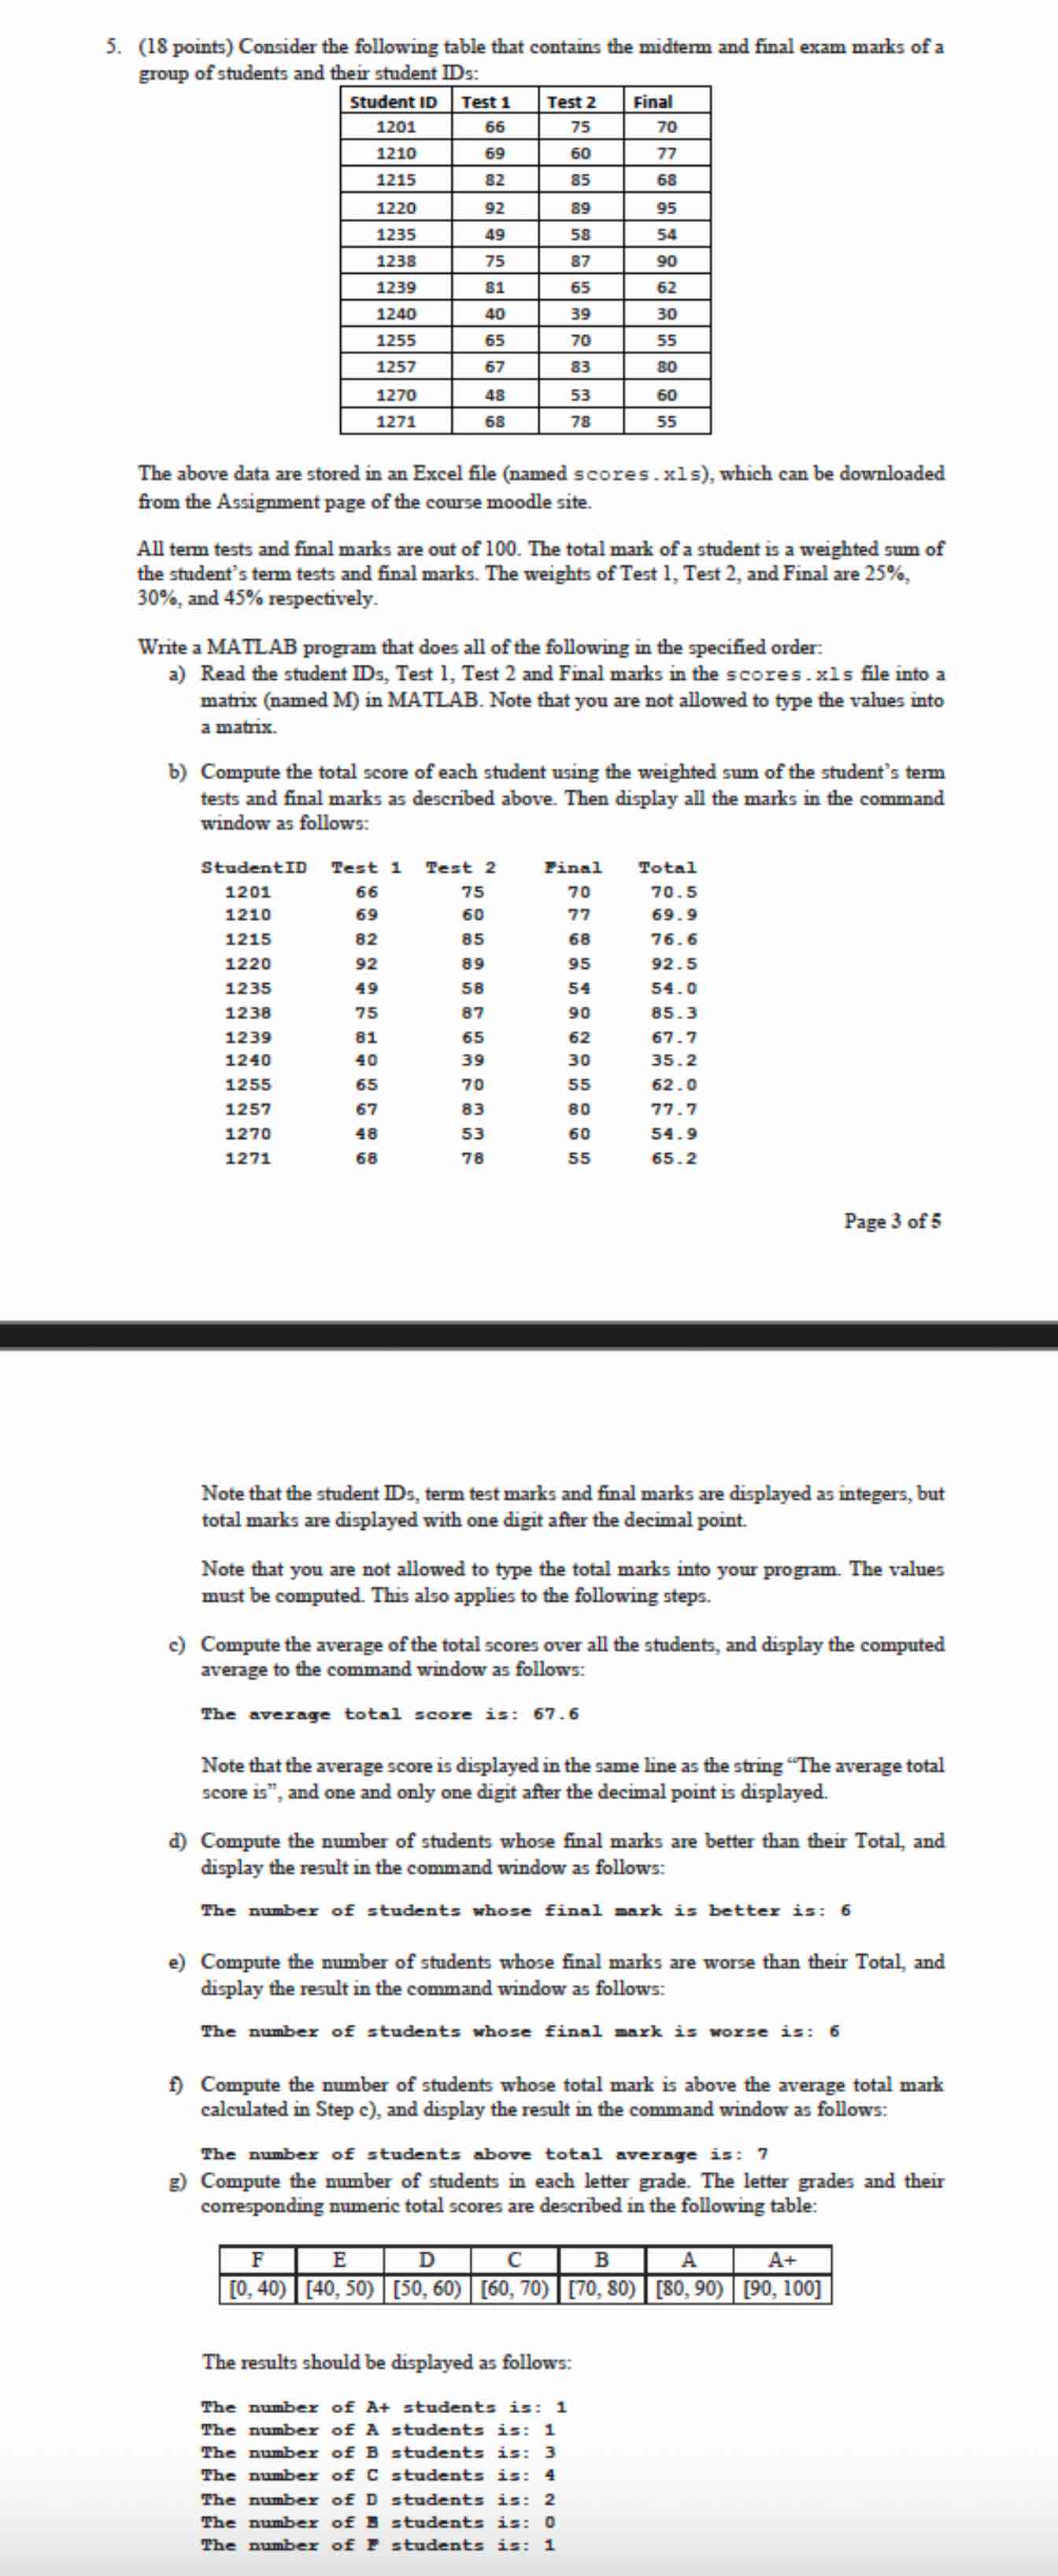
( 1 8 points ) Consider the following table that contains the midterm and final exam marks of a group of students and their student
points Consider the following table that contains the midterm and final exam marks of a
group of students and their student :
The above data are stored in an Excel file named scores. s which can be downloaded
from the Assignment page of the course moodle site.
All term tests and final marks are out of The total mark of a student is a weighted sum of
the student's term tests and final marks. The weights of Test Test and Final are
and respectively.
Write a MATLAB program that does all of the following in the specified order:
a Read the student IDs, Test Test and Final marks in the scores.xs file into a
matrix named M in MATLAB. Note that you are not allowed to type the values into
a matrix.
b Compute the total score of each student using the weighted sum of the student's term
tests and final marks as described above. Then display all the marks in the command
window as follows:
Note that the student IDs, term test marks and final marks are displayed as integers, but
total marks are displayed with one digit after the decimal point.
Note that you are not allowed to type the total marks into your program. The values
must be computed. This also applies to the following steps.
c Compute the average of the total scores over all the students, and display the computed
average to the command window as follows:
The average total score :
Note that the average score is displayed in the same line as the string "The average total
score is and one and only one digit after the decimal point is displayed.
d Compute the number of students whose final marks are better than their Total, and
display the result in the command window as follows:
The number of students whose final maxk is better is:
e Compute the number of students whose final marks are worse than their Total, and
display the result in the command window as follows:
The number of students whose final maxk is worse is:
f Compute the number of students whose total mark is above the average total mark
calculated in Step c and display the result in the command window as follows:
The number of students above total average is:
g Compute the number of students in each letter grade. The letter grades and their
corresponding numeric total scores are described in the following table:
The results should be displayed as follows:
The number of At students is:
The number of tudents :
The number of students is:
The number of students is:
The number of students is:
The number of I students :
The number of students :The above data are stored in an Excel file named scores.xls which can be downloaded from the Assignment page of the course moodle site.
All term tests and final marks are out of The total mark of a student is a weighted sum of the students term tests and final marks. The weights of Test Test and Final are and respectively.
Write a MATLAB program that does all of the following in the specified order:
a
Read the student IDs, Test Test and Final marks in the scores.xls file into a matrix named M in MATLAB. Note that you are not allowed to type the values into a matrix.
b
Compute the total score of each student using the weighted sum of the students term tests and final marks as described above. Then display all the marks in the command window as follows:
Step by Step Solution
There are 3 Steps involved in it
Step: 1

Get Instant Access to Expert-Tailored Solutions
See step-by-step solutions with expert insights and AI powered tools for academic success
Step: 2

Step: 3
Ace Your Homework with AI
Get the answers you need in no time with our AI-driven, step-by-step assistance
Get Started