

Answered step by step
Verified Expert Solution
Question
1 Approved Answer
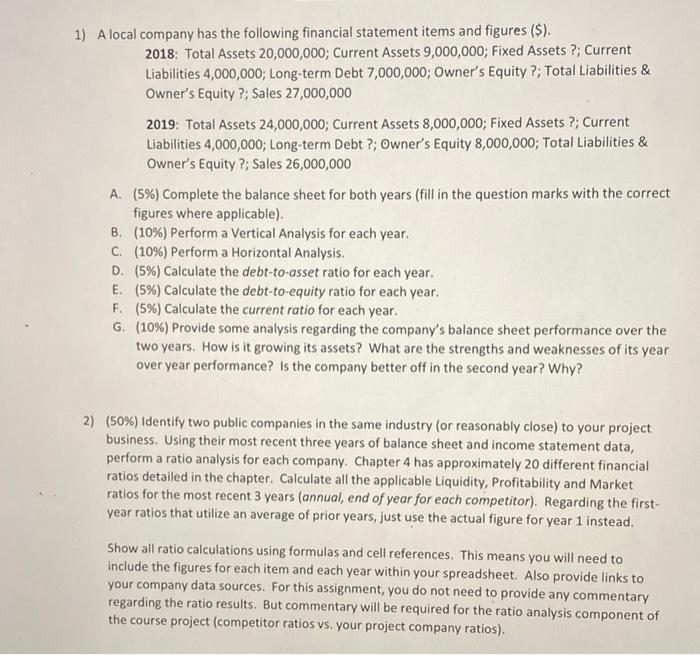
1) A local company has the following financial statement items and figures ($). 2018: Total Assets 20,000,000; Current Assets 9,000,000; Fixed Assets ?, Current Liabilities
Step by Step Solution
There are 3 Steps involved in it
Step: 1

Get Instant Access to Expert-Tailored Solutions
See step-by-step solutions with expert insights and AI powered tools for academic success
Step: 2

Step: 3
Ace Your Homework with AI
Get the answers you need in no time with our AI-driven, step-by-step assistance
Get Started
Microfinance And Its Impact On Entrepreneurial Development Sustainability And Inclusive Growth
Authors: Ramesh Chandra Das
1st Edition
1522552138, 1522552146, 9781522552130, 9781522552147