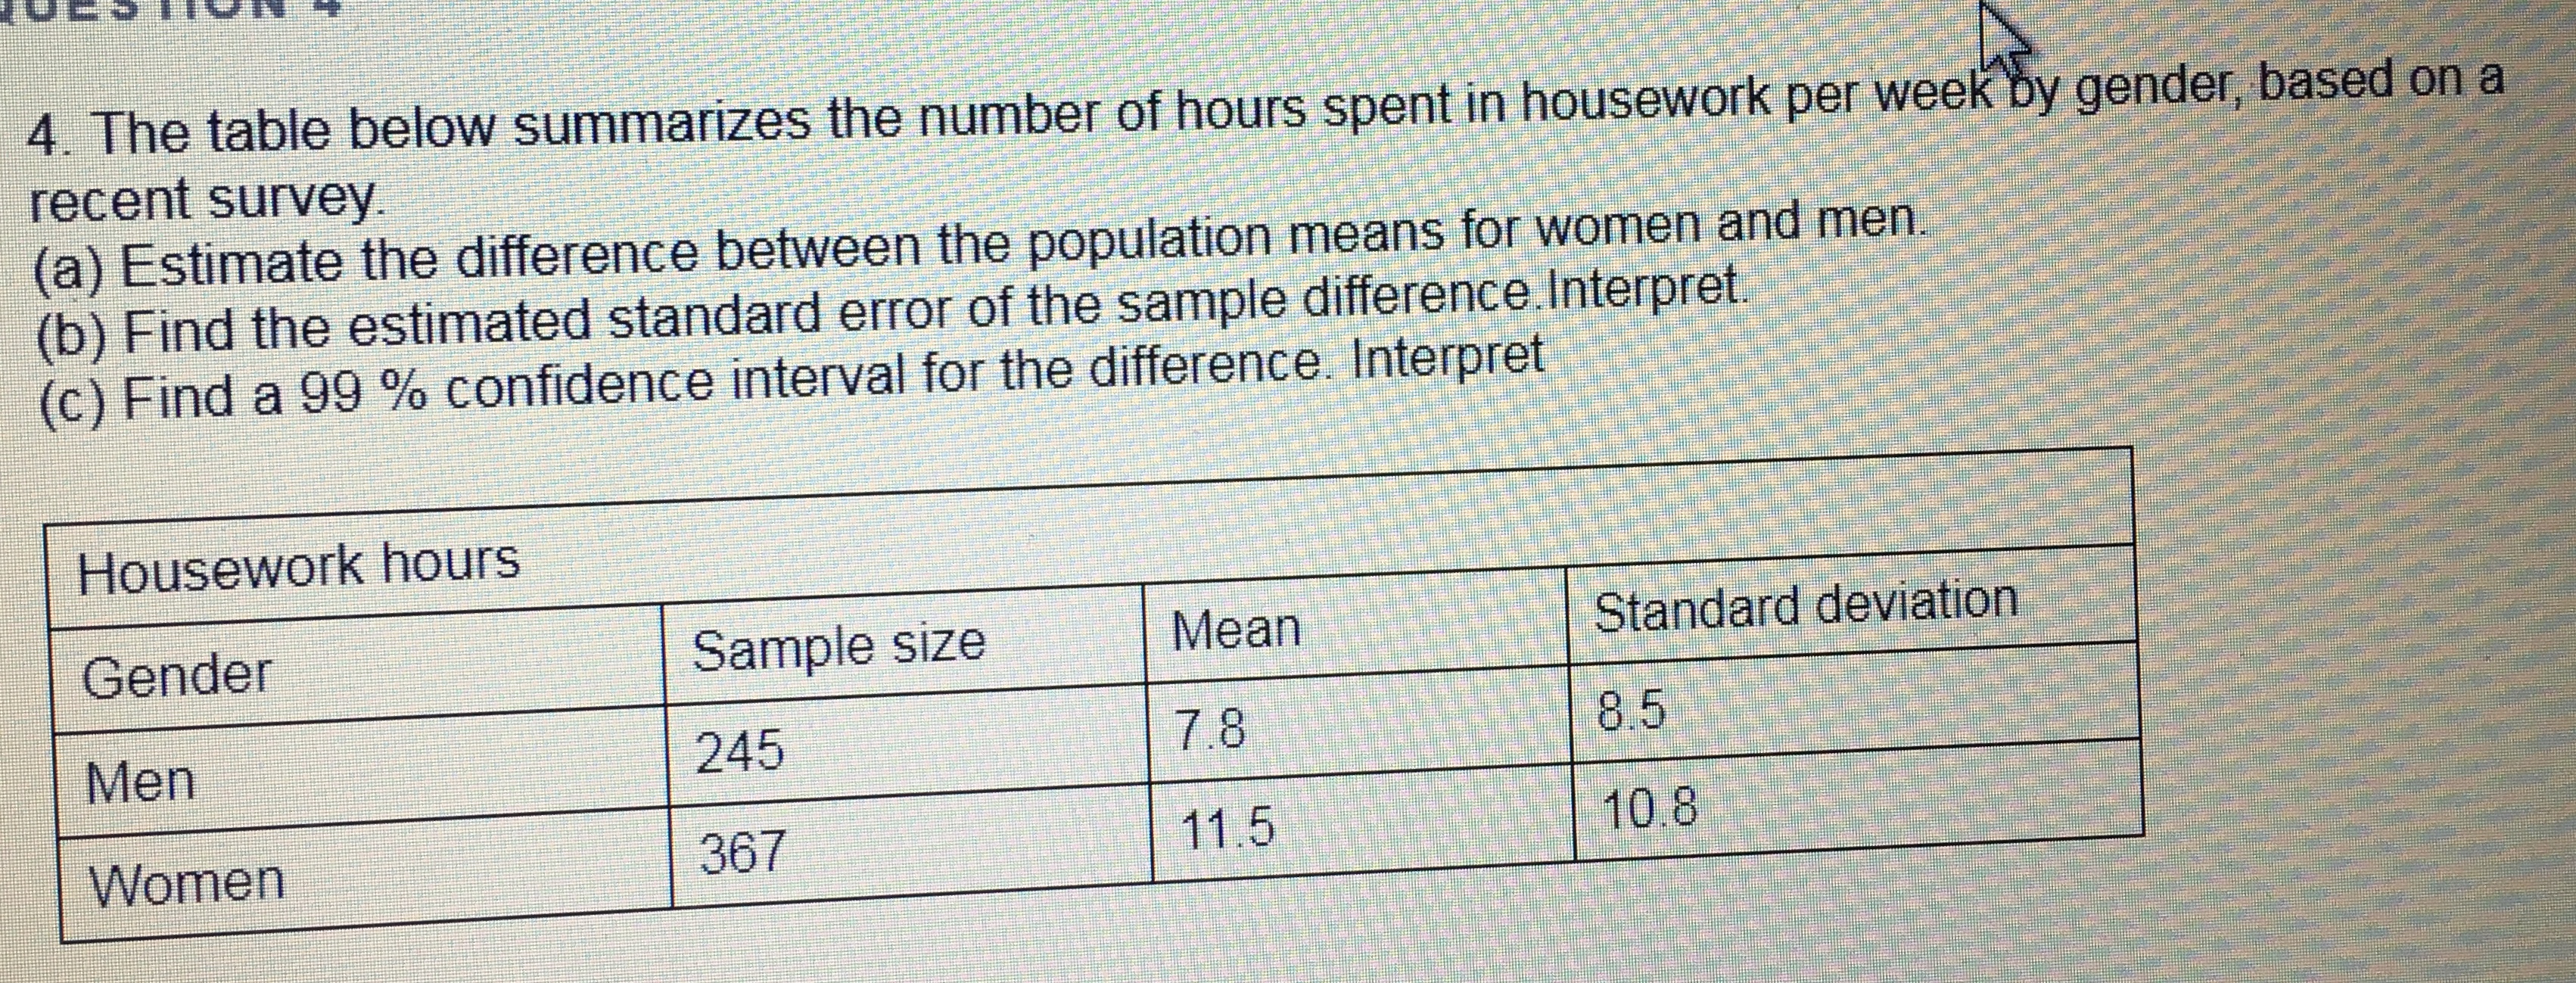
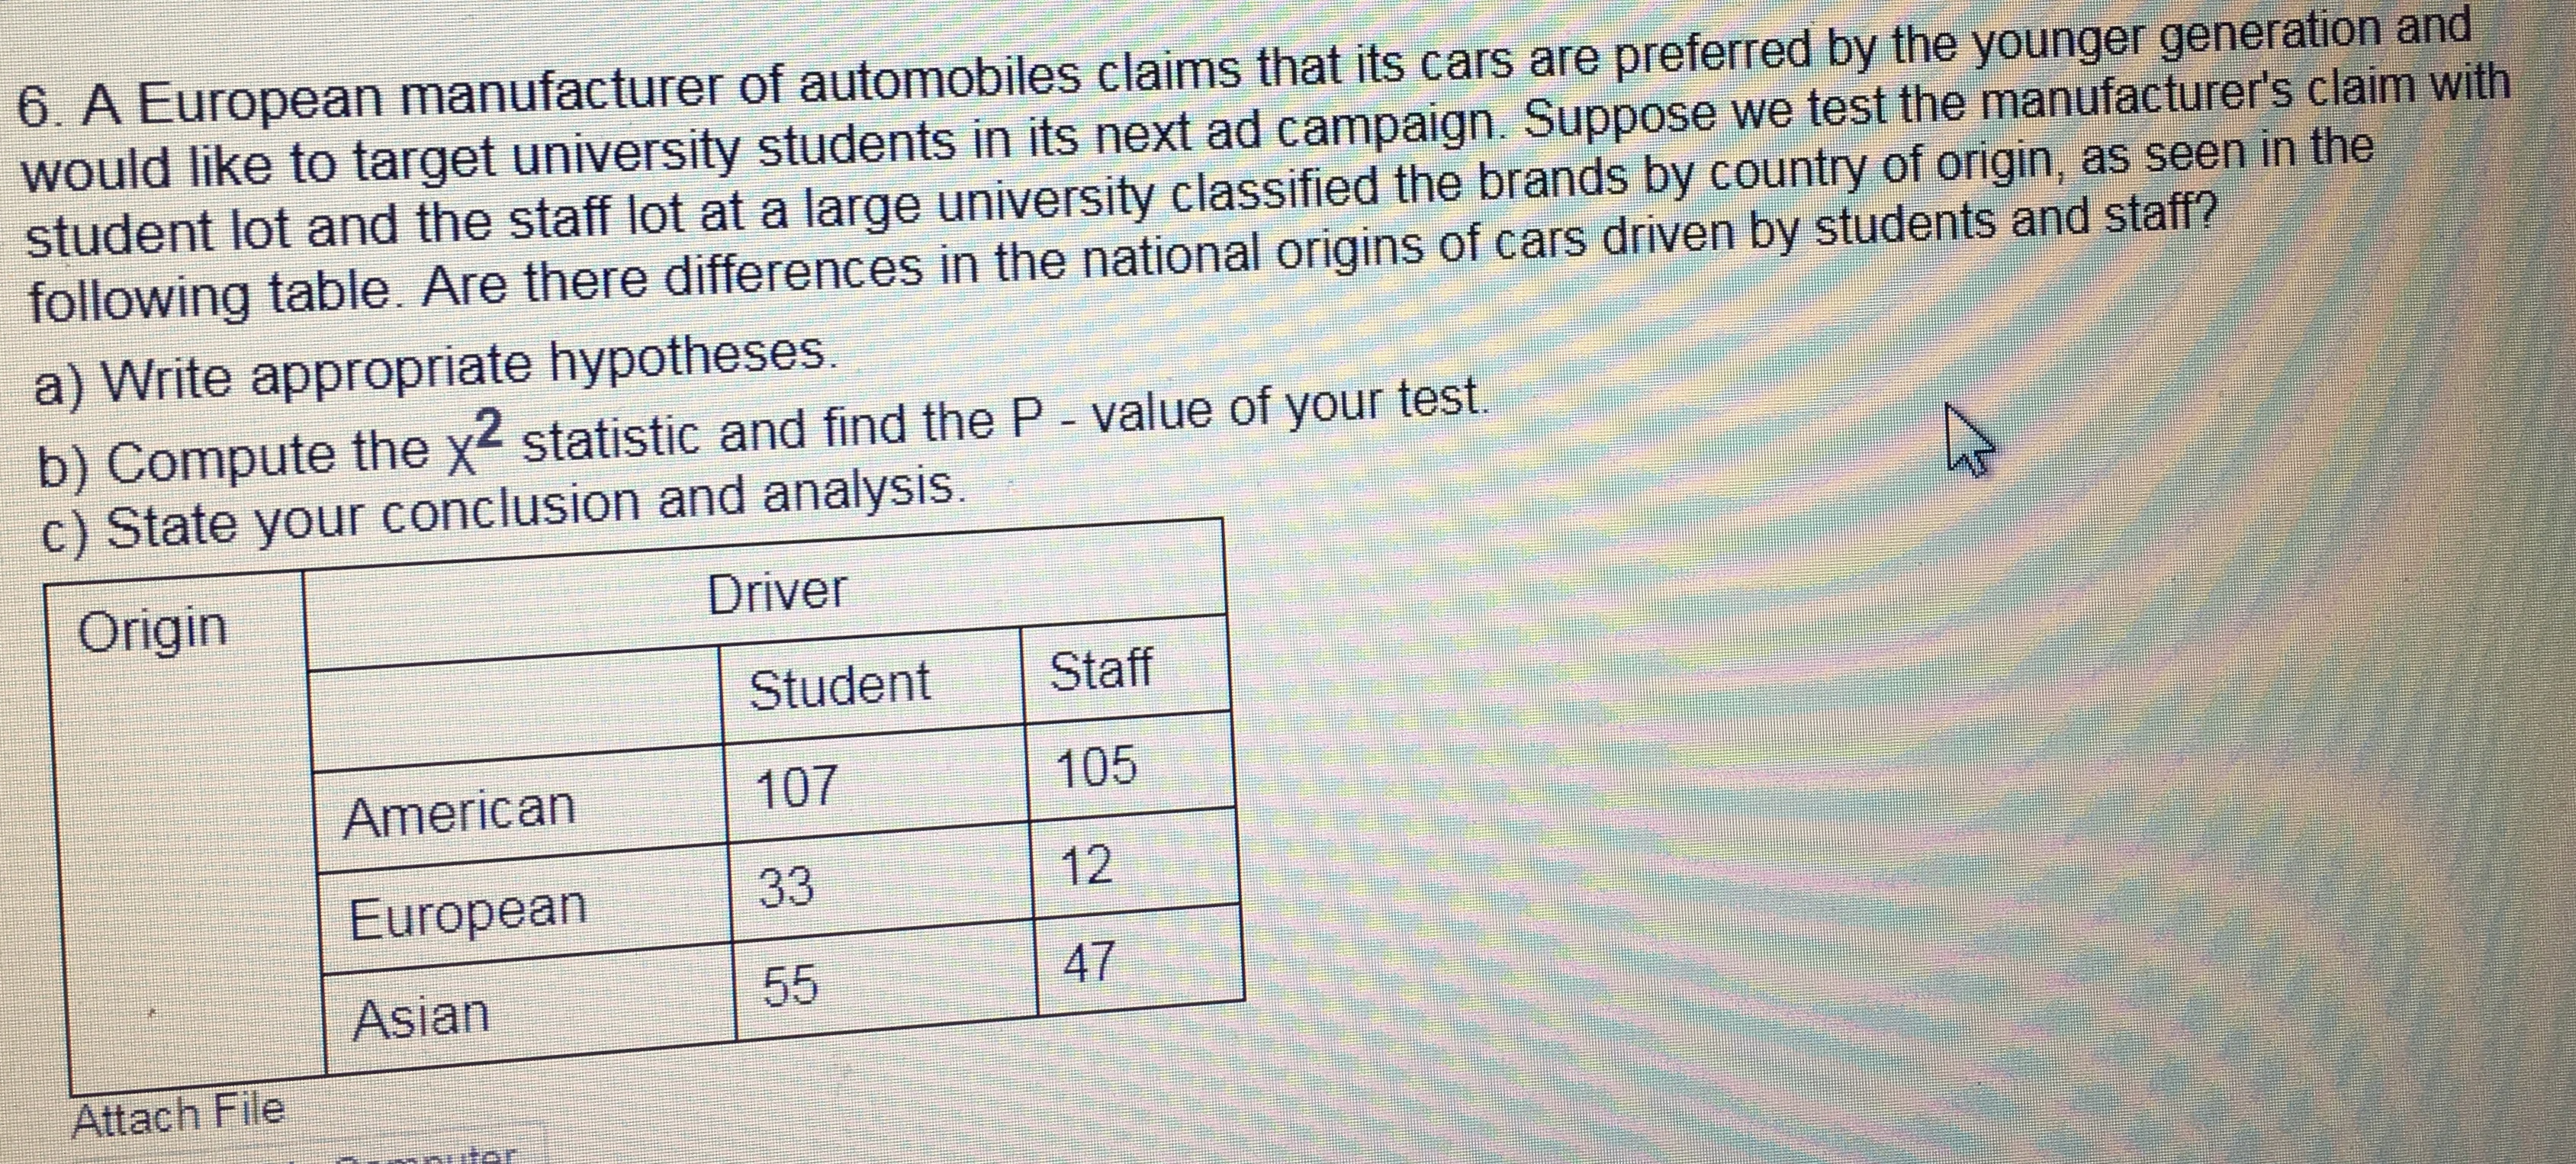
Question
1. A mayoral election in North Bay, Ontario, has twocandidates. Exactly half the residents currently prefereach candidate. (a) For a random sample of 600 voters,
1. A mayoral election in North Bay, Ontario, has twocandidates. Exactly half the residents currently prefereach candidate.
(a) For a random sample of 600 voters, 290 voted for a particular candidate. Are you willing to predict the winner?Why?
(b) For a random sample of 60 voters, 29 voted for a particularcandidate. Would you be willing to predict the winner? Why?
2. Mary and Joe separately conduct studies to testHo:?= 300 against Ho:??300, each with n = 800.
Mary gets?= 219.5, with se = 5 Joe gets?= 219.7,with se = 8
(a) Calculate the test statistic and P -value for both.
(b) Using a = 0.050, for each study indicate whether theresult is " statistically significant. "
3. The table below summarizes responses from General social Surveys in 1980 and in 2016 to the statement "is much better for everyone involved if the man is theachiever outside the home and the woman takes catthe home and family. " Let?1denotethe population proportion who agreed with this statement in 1980, and let?2denote the population proportion in 2016.
(a)Calculatethe95 % confidence interval.
b) Explain how results would differ for comparing the proportions who did not agree in the two years
TABLE
YearAgreeDisagreeTotal
19807964861282
201645611151571
5. At a major credit card company, the percentages ofpeople who historically apply for the Silver, Gold, andPlatinum cards are 60 %, 30 %, and 10 %, respectively. Ina recent sample of customers responding to a promotion,of 200 customers, 110 applied for Silver, 55 for Gold, and35 for Platinum. We are interested in whether the percentages for this promotion are different from the historicalpercentages.
a) What is the expected number of customers applying foreach type of card in this sample if the historical proportions are still true?
b) Compute the?2statistic.
c) How many degrees of freedom does the?2statistichave?
6.


Step by Step Solution
There are 3 Steps involved in it
Step: 1

Get Instant Access to Expert-Tailored Solutions
See step-by-step solutions with expert insights and AI powered tools for academic success
Step: 2

Step: 3

Ace Your Homework with AI
Get the answers you need in no time with our AI-driven, step-by-step assistance
Get Started


