

Answered step by step
Verified Expert Solution
Question
1 Approved Answer
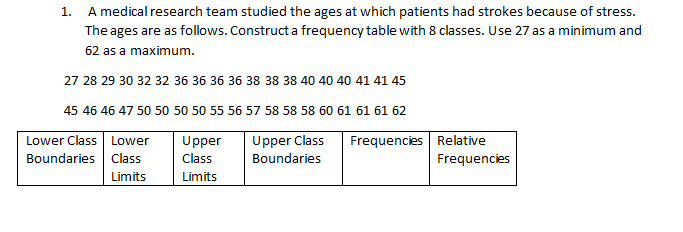
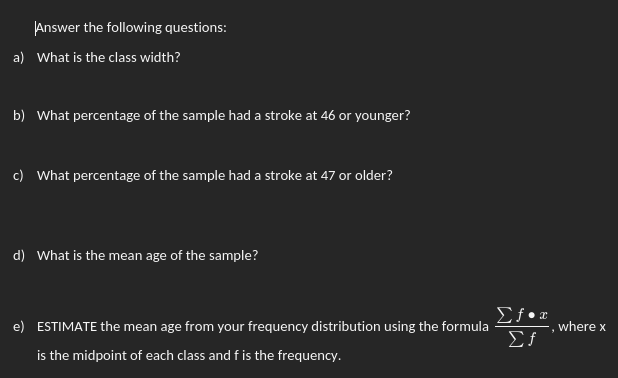
1. A medical research team studied the ages at which patients had strokes because of stress. The ages are as follows. Construct a frequency table


Step by Step Solution
There are 3 Steps involved in it
Step: 1

Get Instant Access to Expert-Tailored Solutions
See step-by-step solutions with expert insights and AI powered tools for academic success
Step: 2

Step: 3
Ace Your Homework with AI
Get the answers you need in no time with our AI-driven, step-by-step assistance
Get Started
Statistics Learning From Data
Authors: Roxy Peck
1st Edition
495553263, 978-1285966083, 1285966082, 978-0495553267