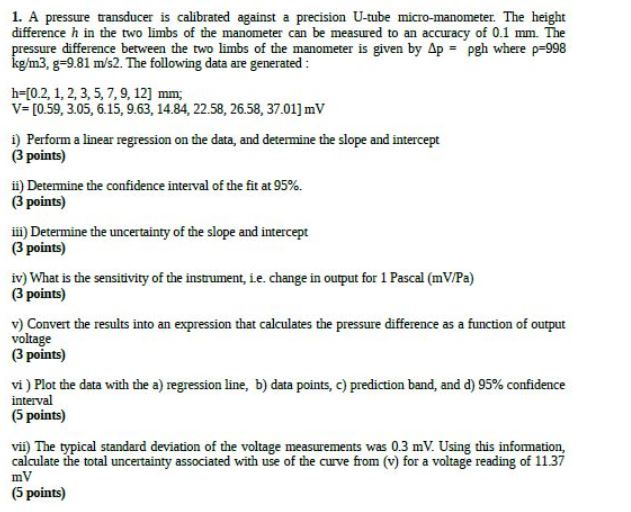
1. A pressure transducer is calibrated against a precision U-tube micro-manometer. The height difference h in the two limbs of the manometer can be measured to an accuracy of 0.1 mm. The pressure difference between the two limbs of the manometer is given by Ap = pgh where p=998 kg/m3, g=9.81 m/s2. The following data are generated : h=[0.2, 1,2,3,5,7,9, 12] mm; V=[0.59, 3.05, 6.15, 9.63, 14.84, 22.58, 26.58, 37.01) mV 1) Perform a linear regression on the data, and determine the slope and intercept (3 points) ii) Determine the confidence interval of the fit at 95%. (3 points) ii) Determine the uncertainty of the slope and intercept (3 points) iv) What is the sensitivity of the instrument, i.e. change in output for 1 Pascal (mV/Pa) (3 points) v) Convert the results into an expression that calculates the pressure difference as a function of output voltage (3 points) prediction band, and d) 95% confidence vi ) Plot the data with the a) regression line, b) data points, interval (5 points) vii) The typical standard deviation of the voltage measurements was 0.3 mV. Using this information, calculate the total uncertainty associated with use of the curve from (v) for a voltage reading of 11.37 mV (5 points) 1. A pressure transducer is calibrated against a precision U-tube micro-manometer. The height difference h in the two limbs of the manometer can be measured to an accuracy of 0.1 mm. The pressure difference between the two limbs of the manometer is given by Ap = pgh where p=998 kg/m3, g=9.81 m/s2. The following data are generated : h=[0.2, 1,2,3,5,7,9, 12] mm; V=[0.59, 3.05, 6.15, 9.63, 14.84, 22.58, 26.58, 37.01) mV 1) Perform a linear regression on the data, and determine the slope and intercept (3 points) ii) Determine the confidence interval of the fit at 95%. (3 points) ii) Determine the uncertainty of the slope and intercept (3 points) iv) What is the sensitivity of the instrument, i.e. change in output for 1 Pascal (mV/Pa) (3 points) v) Convert the results into an expression that calculates the pressure difference as a function of output voltage (3 points) prediction band, and d) 95% confidence vi ) Plot the data with the a) regression line, b) data points, interval (5 points) vii) The typical standard deviation of the voltage measurements was 0.3 mV. Using this information, calculate the total uncertainty associated with use of the curve from (v) for a voltage reading of 11.37 mV (5 points)


