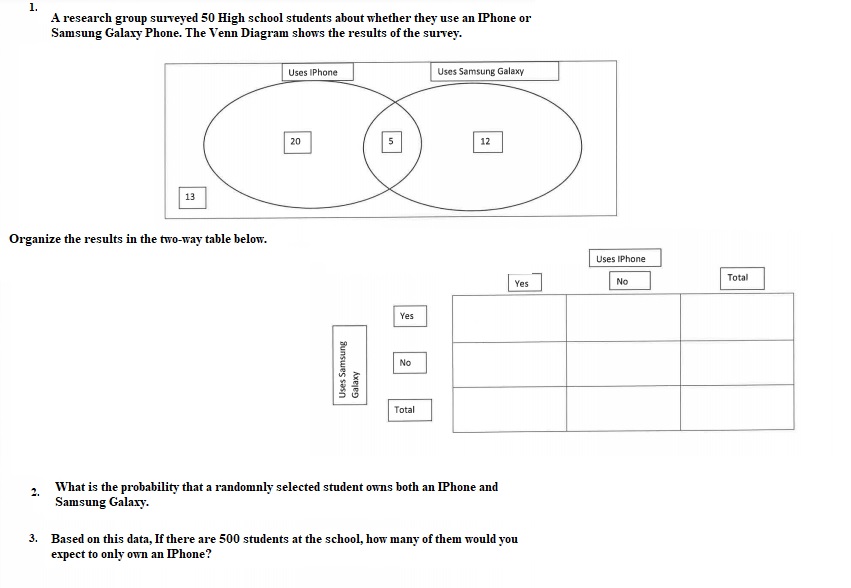
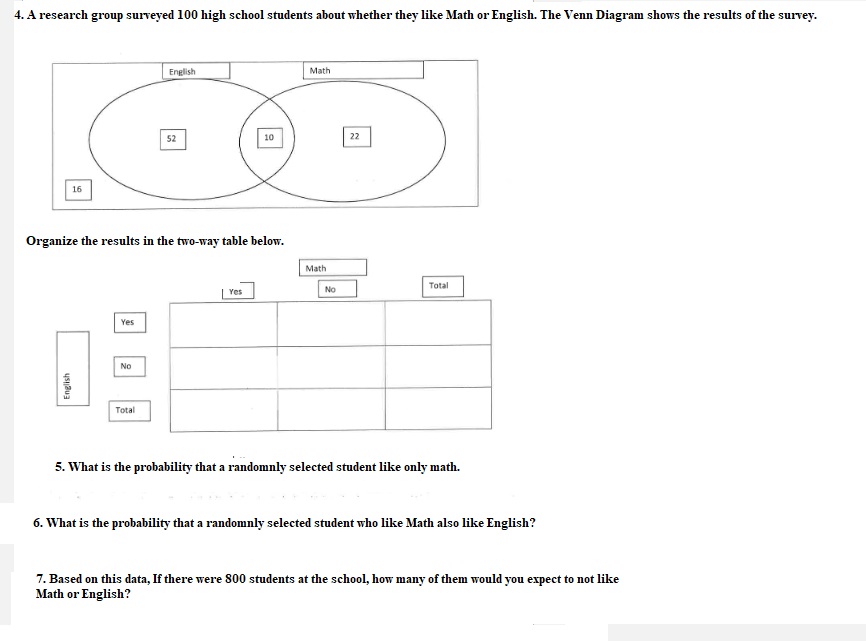
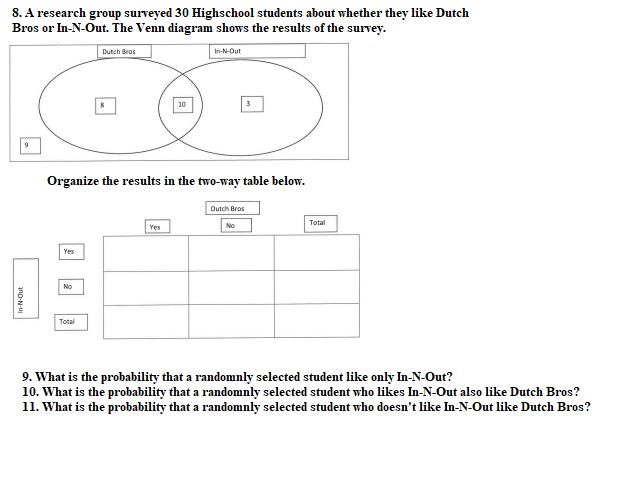
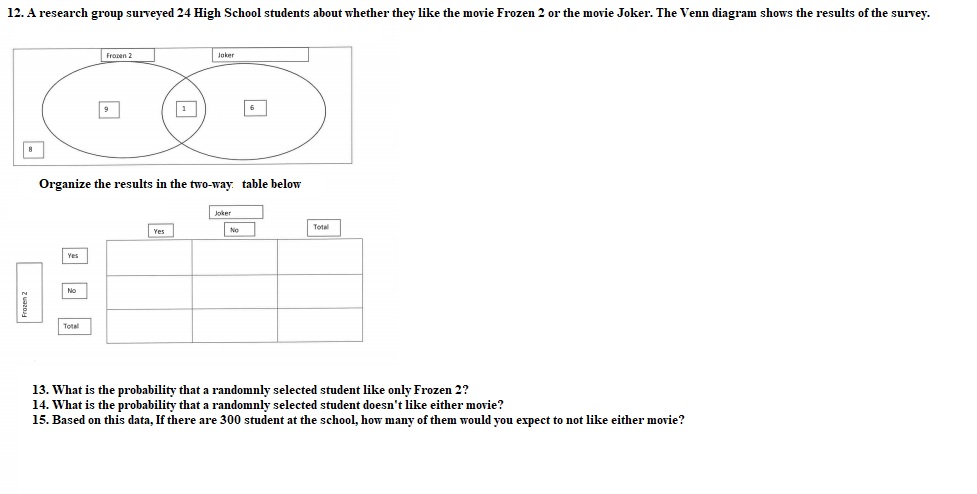
1. A research group surveyed 50 High school students about whether they use an IPhone or Samsung Galaxy Phone. The Venn Diagram shows the results of the survey. Uses IPhone Uses Samsung Galaxy 20 5 12 13 Organize the results in the two-way table below. Uses IPhone Yes No Total Yes No Uses Samsung Galaxy Total 2. What is the probability that a randomly selected student owns both an IPhone and Samsung Galaxy. 3. Based on this data, If there are 500 students at the school, how many of them would you expect to only own an IPhone?4. A research group surveyed 100 high school students about whether they like Math or English. The Venn Diagram shows the results of the survey. English Math 52 10 22 16 Organize the results in the two-way table below. Math Yes No Total Yes English Total 5. What is the probability that a randomnly selected student like only math. 6. What is the probability that a randomnly selected student who like Math also like English? 7. Based on this data, If there were 800 students at the school, how many of them would you expect to not like Math or English?8. A research group surveyed 30 Highschool students about whether they like Dutch Bros or In-N-Out. The Venn diagram shows the results of the survey. Dutch Bros In-N-Out 10 3 9 Organize the results in the two-way table below. Dutch Bros Yes No Total In-N-Out Total 9. What is the probability that a randomnly selected student like only In-N-Out? 10. What is the probability that a randomnly selected student who likes In-N-Out also like Dutch Bros? 11. What is the probability that a randomnly selected student who doesn't like In-N-Out like Dutch Bros?12. A research group surveyed 24 High School students about whether they like the movie Frozen 2 or the movie Joker. The Venn diagram shows the results of the survey. Frocan Joker 9 1 6 Organize the results in the two-way. table below Joker Yes No YE NO Frozen 2 Total 13. What is the probability that a randomnly selected student like only Frozen 2? 14. What is the probability that a randomnly selected student doesn't like either movie? 15. Based on this data, If there are 300 student at the school, how many of them would you expect to not like either movie


