Answered step by step
Verified Expert Solution
Link Copied!

Question

1 Approved Answer

1. A researcher conducted a survey to examine which fruit people think is the nicest. The results are presented in the graph: 40- Nicest Fruit
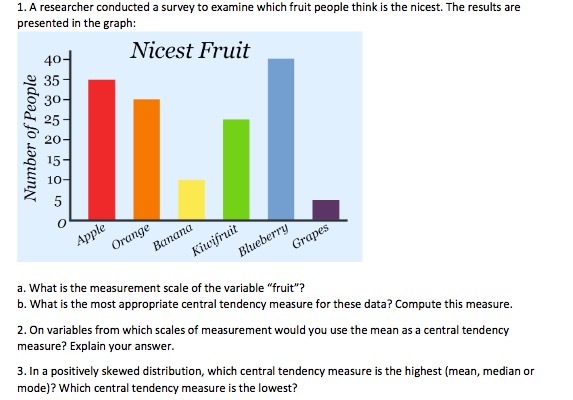
image text in transcribed
1. A researcher conducted a survey to examine which fruit people think is the nicest. The results are presented in the graph: 40- Nicest Fruit Number of People 35 30 25 20 5 10 Apple Orange Banana Kiwifruit Blueberry Grapes a. What is the measurement scale of the variable "fruit"? b. What is the most appropriate central tendency measure for these data? Compute this measure. 2. On variables from which scales of measurement would you use the mean as a central tendency measure? Explain your answer. 3. In a positively skewed distribution, which central tendency measure is the highest (mean, median or mode)? Which central tendency measure is the lowest

Step by Step Solution

There are 3 Steps involved in it

Step: 1

blur-text-image

Get Instant Access to Expert-Tailored Solutions

See step-by-step solutions with expert insights and AI powered tools for academic success

Step: 2

blur-text-image

Step: 3

blur-text-image

Ace Your Homework with AI

Get the answers you need in no time with our AI-driven, step-by-step assistance

Get Started

Recommended Textbook for

An Introduction to the Mathematics of financial Derivatives

Authors: Salih N. Neftci

2nd Edition

978-0125153928, 9780080478647, 125153929, 978-0123846822

More Books

Students also viewed these Mathematics questions