Question
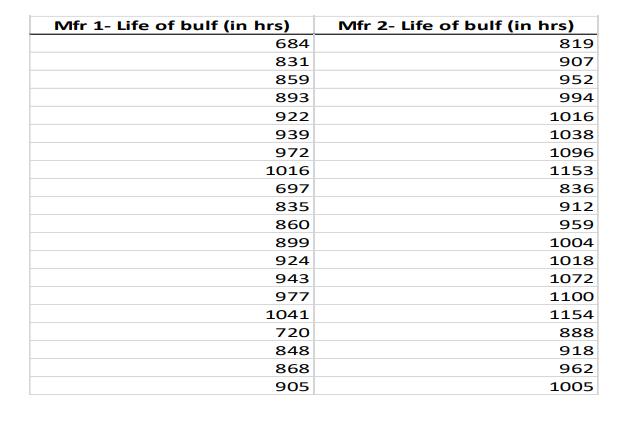
1. A sample of 20 bulbs each was picked from the manufacturing facility of two bulb manufacturers Mfr 1 and Mfr 2. The table
1. A sample of 20 bulbs each was picked from the manufacturing facility of two bulb manufacturers – Mfr 1 and Mfr 2. The table above provides the life of bulbs for the two manufacturers. You are a quality testing person and are presented with this data:
i. Which manufacturer has better performance on the life of bulbs? What are the different measures you can consider to calculate performance?
ii. How would you assess the variability in the performance of the two bulb manufacturers?
iii. Would your answer to the first question change based on your assessment of the variability in the performance of bulb manufacturers?

Mfr 1- Life of bulf (in hrs) Mfr 2- Life of bulf (in hrs) 684 819 831 907 859 952 893 994 922 1016 939 1038 972 1096 1016 1153 697 836 835 912 860 959 899 1004 924 1018 943 1072 977 1100 1041 1154 720 888 848 918 868 962 905 1005
Step by Step Solution
There are 3 Steps involved in it
Step: 1
Ans1 Second manufacturer has better performance on the life of bulbs The different measured that can ...
Get Instant Access to Expert-Tailored Solutions
See step-by-step solutions with expert insights and AI powered tools for academic success
Step: 2

Step: 3

Ace Your Homework with AI
Get the answers you need in no time with our AI-driven, step-by-step assistance
Get Started


