Question
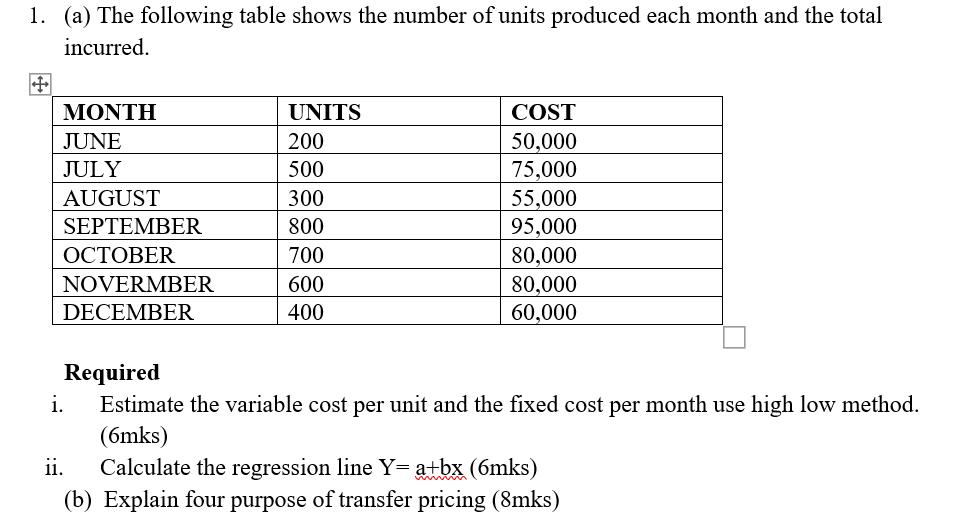
1. (a) The following table shows the number of units produced each month and the total incurred. MONTH UNITS COST 50,000 75,000 55,000 95,000

1. (a) The following table shows the number of units produced each month and the total incurred. MONTH UNITS COST 50,000 75,000 55,000 95,000 80,000 JUNE 200 JULY 500 AUGUST 300 SEPTEMBER 800 ER 700 NOVERMBER 600 80,000 DECEMBER 400 60,000 Required i. Estimate the variable cost per unit and the fixed cost per month use high low method. (6mks) Calculate the regression line Y= a+bx (6mks) ii. (b) Explain four purpose of transfer pricing (8mks)
Step by Step Solution
There are 3 Steps involved in it
Step: 1
Sdution 1 i Estimate Variable cast per Unit and the fixed cast per month using High how method ...
Get Instant Access to Expert-Tailored Solutions
See step-by-step solutions with expert insights and AI powered tools for academic success
Step: 2

Step: 3

Ace Your Homework with AI
Get the answers you need in no time with our AI-driven, step-by-step assistance
Get StartedRecommended Textbook for
Quantitative Methods For Business
Authors: Donald Waters
5th Edition
273739476, 978-0273739470
Students also viewed these Accounting questions
Question
Answered: 1 week ago
Question
Answered: 1 week ago
Question
Answered: 1 week ago
Question
Answered: 1 week ago
Question
Answered: 1 week ago
Question
Answered: 1 week ago
Question
Answered: 1 week ago
Question
Answered: 1 week ago
Question
Answered: 1 week ago
Question
Answered: 1 week ago
Question
Answered: 1 week ago
Question
Answered: 1 week ago
Question
Answered: 1 week ago
Question
Answered: 1 week ago
Question
Answered: 1 week ago
Question
Answered: 1 week ago
Question
Answered: 1 week ago
Question
Answered: 1 week ago
Question
Answered: 1 week ago
Question
Answered: 1 week ago
Question
Answered: 1 week ago
Question
Answered: 1 week ago
Question
Answered: 1 week ago
Question
Answered: 1 week ago
View Answer in SolutionInn App


