

Question: 1 a. What happens to ticket prices over time? b. What impact does buying more tickets per transaction have on the expected fare? Table 1.
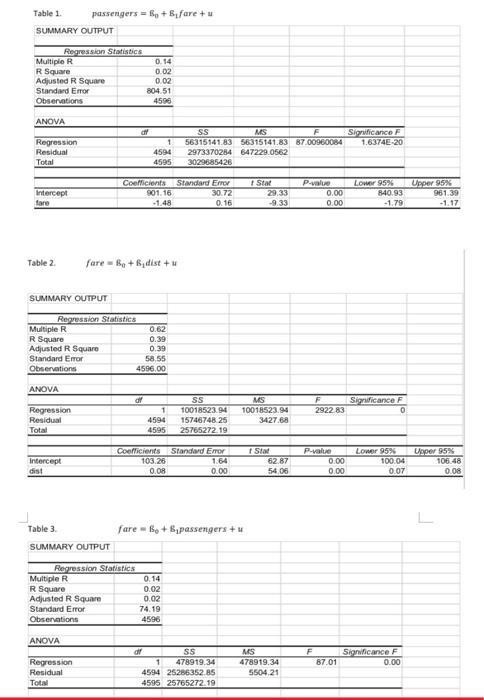
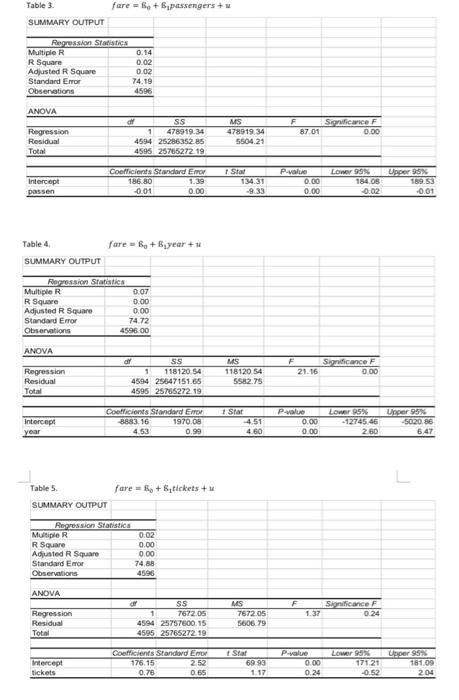
1 a. What happens to ticket prices over time?
b. What impact does buying more tickets per transaction have on the expected fare?
Table 1. passengers - + fare + SUMMARY OUTPUT Regression Statistics Multiple R 0.14 R Square 0.02 Adjusted R Square 0.02 Standard Error 804 51 Observations 4590 ANOVA Significance F 1.6374E-20 Regression Residual Total 1 4594 4595 SS MS 56315141.83 56315141.83 87.00960084 2973370284 647229.0562 3029685426 Stad Intercept Care Coefficient 901.16 -1.48 Standard Error 30.72 0.16 29.33 -9.33 P-value 0.00 0.00 Lower 95% 840.93 -1.79 Upper 95% 961.39 -1.17 Table 2 fare+dist + u SUMMARY OUTPUT Regression Statistics Multiple R 0.62 R Square 0.39 Adjusted R Square 0.39 Standard Error 58.55 Observations 4596.00 ANOVA or F Significance F 2922.83 0 Regression Residual Total 1 4594 4595 SS 10018523.94 15746748.25 25765272.19 MS 10018523.90 3427.68 Intercept dist Coefficients Standard Error 103.26 1.64 0.08 0.00 Stad 62.87 54 05 P-value 0.00 0.00 Lower 95% 100.04 0.07 Upper 95% 106.48 0.08 Table 3. fare 6 +8, passengers + u SUMMARY OUTPUT Regression Statistics Multiple R R Square Adjusted R Square Standard Error Obserations 0.14 0.02 0.02 74.19 4596 ANOVA F 87.01 MS 478919.34 5504.21 Significance F 0.00 Regression Residual or SS 1 478919.34 4594 25286352.85 4595 25765272.19 Total Table 3. fare = + passengers SUMMARY OUTPUT Regression Statistics Multiple R 0.14 R Square 0.02 Adjusted R Square 0.02 Standard Error 74.19 Observations 4596 ANOVA F 87 01 MS 478919 34 550421 Significance F 000 Regression Residual Total SS 1 478919.34 4594 2528635285 4595 2570527219 Intercept passen Coefficients Standard Error 186.80 1.39 -0.01 0.00 Star 13437 -933 P.value 0.00 0.00 Lower SSS 164.08 -0.02 Upper 95% 189.53 -0.01 Table 4 fare = + 8 year + SUMMARY OUTPUT Repression Statistics Multiple R 0.07 R Square 0.00 Adjusted R Square 0.00 Standard Error 74.72 Observations 4596.00 ANOVA F 21.16 MS 118120.54 5582.75 Significance F 000 Regression Residual Total af SS 1 118120 54 4594 256047151 65 4595 25766272.19 Coefficients Standard Enor 8883.16 1970.08 453 0.99 Stat 4.51 Intercept year Palue 0.00 0.00 Lower SX - 12745.46 2.60 Upper 95 SOZO 86 6.47 4.60 fare = R + Stickets + Tables SUMMARY OUTPUT Regression Statistics Multiple R 0.02 R Square 0.00 Adjusted R Square 0.00 Standard Error 74.88 Observations 4596 ANOVA F Significance F 0.24 MS 767205 5606.79 Regression Residual Total 1.37 of SS 1 767205 4594 25757600.15 4595 2576527219 Intercept tickets Coefficients Standard Em 176.15 2.52 0.76 0.65 Stat 69.93 1.17 P value 0.00 0.24 Lower 95% 17121 -0.52 18109 204 Table 1. passengers - + fare + SUMMARY OUTPUT Regression Statistics Multiple R 0.14 R Square 0.02 Adjusted R Square 0.02 Standard Error 804 51 Observations 4590 ANOVA Significance F 1.6374E-20 Regression Residual Total 1 4594 4595 SS MS 56315141.83 56315141.83 87.00960084 2973370284 647229.0562 3029685426 Stad Intercept Care Coefficient 901.16 -1.48 Standard Error 30.72 0.16 29.33 -9.33 P-value 0.00 0.00 Lower 95% 840.93 -1.79 Upper 95% 961.39 -1.17 Table 2 fare+dist + u SUMMARY OUTPUT Regression Statistics Multiple R 0.62 R Square 0.39 Adjusted R Square 0.39 Standard Error 58.55 Observations 4596.00 ANOVA or F Significance F 2922.83 0 Regression Residual Total 1 4594 4595 SS 10018523.94 15746748.25 25765272.19 MS 10018523.90 3427.68 Intercept dist Coefficients Standard Error 103.26 1.64 0.08 0.00 Stad 62.87 54 05 P-value 0.00 0.00 Lower 95% 100.04 0.07 Upper 95% 106.48 0.08 Table 3. fare 6 +8, passengers + u SUMMARY OUTPUT Regression Statistics Multiple R R Square Adjusted R Square Standard Error Obserations 0.14 0.02 0.02 74.19 4596 ANOVA F 87.01 MS 478919.34 5504.21 Significance F 0.00 Regression Residual or SS 1 478919.34 4594 25286352.85 4595 25765272.19 Total Table 3. fare = + passengers SUMMARY OUTPUT Regression Statistics Multiple R 0.14 R Square 0.02 Adjusted R Square 0.02 Standard Error 74.19 Observations 4596 ANOVA F 87 01 MS 478919 34 550421 Significance F 000 Regression Residual Total SS 1 478919.34 4594 2528635285 4595 2570527219 Intercept passen Coefficients Standard Error 186.80 1.39 -0.01 0.00 Star 13437 -933 P.value 0.00 0.00 Lower SSS 164.08 -0.02 Upper 95% 189.53 -0.01 Table 4 fare = + 8 year + SUMMARY OUTPUT Repression Statistics Multiple R 0.07 R Square 0.00 Adjusted R Square 0.00 Standard Error 74.72 Observations 4596.00 ANOVA F 21.16 MS 118120.54 5582.75 Significance F 000 Regression Residual Total af SS 1 118120 54 4594 256047151 65 4595 25766272.19 Coefficients Standard Enor 8883.16 1970.08 453 0.99 Stat 4.51 Intercept year Palue 0.00 0.00 Lower SX - 12745.46 2.60 Upper 95 SOZO 86 6.47 4.60 fare = R + Stickets + Tables SUMMARY OUTPUT Regression Statistics Multiple R 0.02 R Square 0.00 Adjusted R Square 0.00 Standard Error 74.88 Observations 4596 ANOVA F Significance F 0.24 MS 767205 5606.79 Regression Residual Total 1.37 of SS 1 767205 4594 25757600.15 4595 2576527219 Intercept tickets Coefficients Standard Em 176.15 2.52 0.76 0.65 Stat 69.93 1.17 P value 0.00 0.24 Lower 95% 17121 -0.52 18109 204
Step by Step Solution
There are 3 Steps involved in it

Get step-by-step solutions from verified subject matter experts