

Question
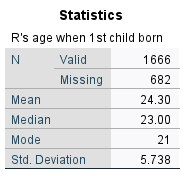
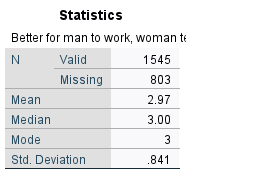
1) AGEKDBRN According to the data in the tables, the mean is 24.30, the median is 23.00, and the mode is 21. The standard deviation
1) AGEKDBRN
According to the data in the tables, the mean is 24.30, the median is 23.00, and the mode is 21. The standard deviation is 5.738, I can determine that one standard deviation of 68% of Americans that age of their firstborn ranges 19 to 30.
Why
SD:
30.038
18.562
Step by Step Solution
There are 3 Steps involved in it
Step: 1

Get Instant Access to Expert-Tailored Solutions
See step-by-step solutions with expert insights and AI powered tools for academic success
Step: 2

Step: 3
Ace Your Homework with AI
Get the answers you need in no time with our AI-driven, step-by-step assistance
Get Started
Differential Equations and Linear Algebra
Authors: Jerry Farlow, James E. Hall, Jean Marie McDill, Beverly H. West
2nd edition
131860615, 978-0131860612