Answered step by step
Verified Expert Solution
Question
1 Approved Answer
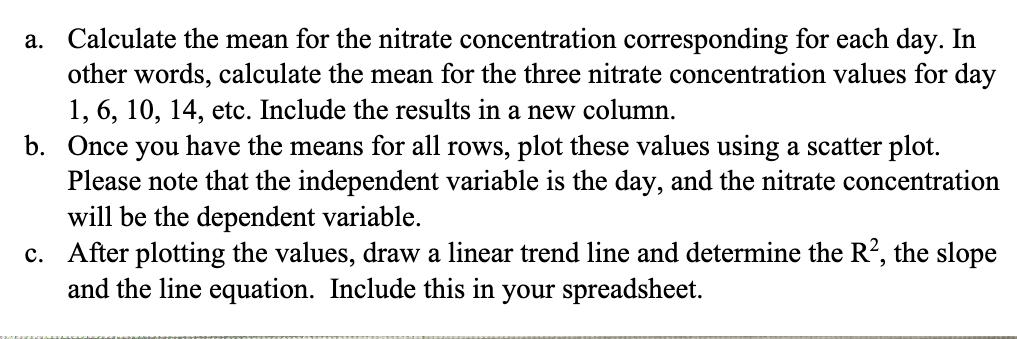
a. Calculate the mean for the nitrate concentration corresponding for each day. In other words, calculate the mean for the three nitrate concentration values
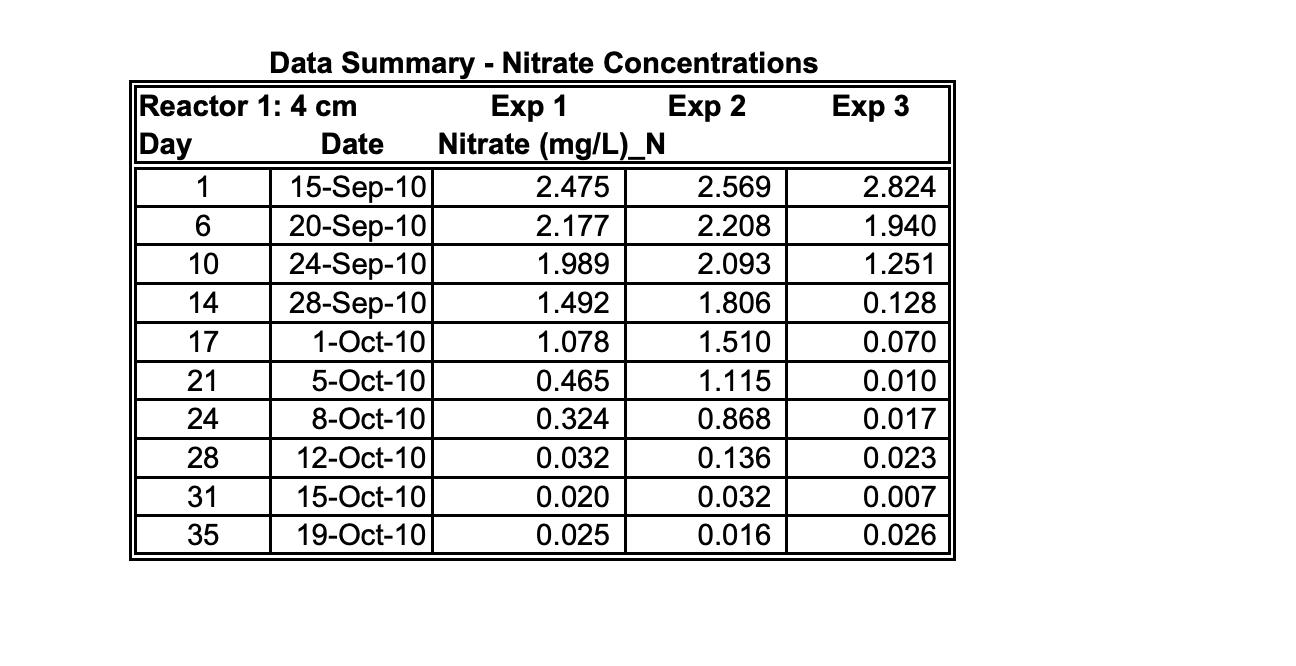
a. Calculate the mean for the nitrate concentration corresponding for each day. In other words, calculate the mean for the three nitrate concentration values for day 1, 6, 10, 14, etc. Include the results in a new column. b. Once you have the means for all rows, plot these values using a scatter plot. Please note that the independent variable is the day, and the nitrate concentration will be the dependent variable. c. After plotting the values, draw a linear trend line and determine the R, the slope and the line equation. Include this in your spreadsheet. Data Summary - Nitrate Concentrations Exp 1 Exp 2 Nitrate (mg/L)_N Reactor 1: 4 cm Day Date 1 15-Sep-10 6 20-Sep-10 10 24-Sep-10 14 28-Sep-10 17 1-Oct-10 21 24 28 31 35 5-Oct-10 8-Oct-10 12-Oct-10 15-Oct-10 19-Oct-10 2.475 2.177 1.989 1.492 1.078 0.465 0.324 0.032 0.020 0.025 2.569 2.208 2.093 1.806 1.510 1.115 0.868 0.136 0.032 0.016 Exp 3 2.824 1.940 1.251 0.128 0.070 0.010 0.017 0.023 0.007 0.026
Step by Step Solution
★★★★★
3.46 Rating (153 Votes )
There are 3 Steps involved in it
Step: 1
a Calculate the mean nitrate concentration for each day Day 1 Exp 1 Nitrate 2475 Exp 2 Nitrate 2569 ...
Get Instant Access to Expert-Tailored Solutions
See step-by-step solutions with expert insights and AI powered tools for academic success
Step: 2

Step: 3

Ace Your Homework with AI
Get the answers you need in no time with our AI-driven, step-by-step assistance
Get Started


