

Answered step by step
Verified Expert Solution
Question
1 Approved Answer
1 and 2 please Include figures of each of the emission spectra you recorded in your report with each peak labeled with their proper wavelength.
1 and 2 please 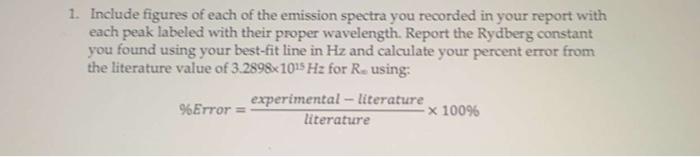
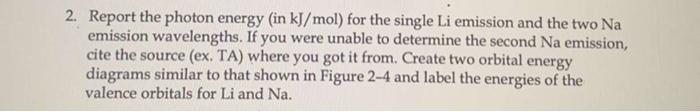
Include figures of each of the emission spectra you recorded in your report with each peak labeled with their proper wavelength. Report the Rydberg constant you found using your best-fit line in Hz and calculate your percent error from the literature value of 3.28981015Hz for Rusing: %Error=literatureexperimentalliterature100% Report the photon energy (in kJ/mol ) for the single Li emission and the two Na emission wavelengths. If you were unable to determine the second Na emission, cite the source (ex. TA) where you got it from. Create two orbital energy diagrams similar to that shown in Figure 2-4 and label the energies of the valence orbitals for Li and Na Step by Step Solution
There are 3 Steps involved in it
Step: 1

Get Instant Access to Expert-Tailored Solutions
See step-by-step solutions with expert insights and AI powered tools for academic success
Step: 2

Step: 3
Ace Your Homework with AI
Get the answers you need in no time with our AI-driven, step-by-step assistance
Get Started
Organic Chemistry
Authors: Graham Solomons, Craig Fryhle, Scott Snyder
11th edition
1118133579, 978-1118133576